
#Documentation
| Topic | Includes | Guide |
|---|---|---|
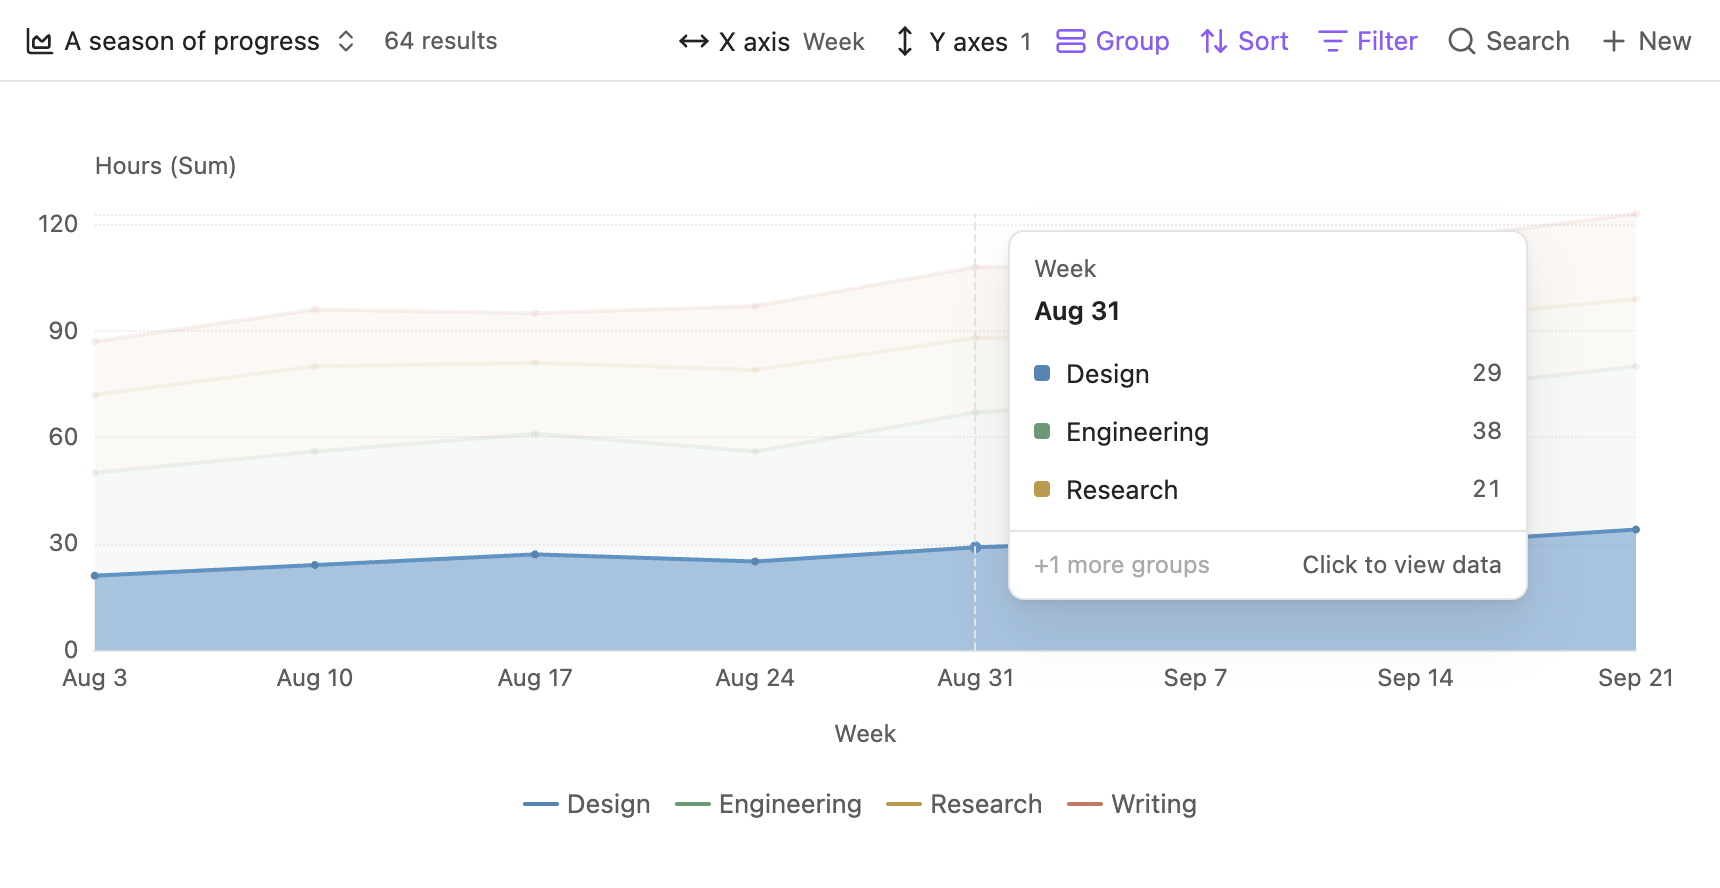
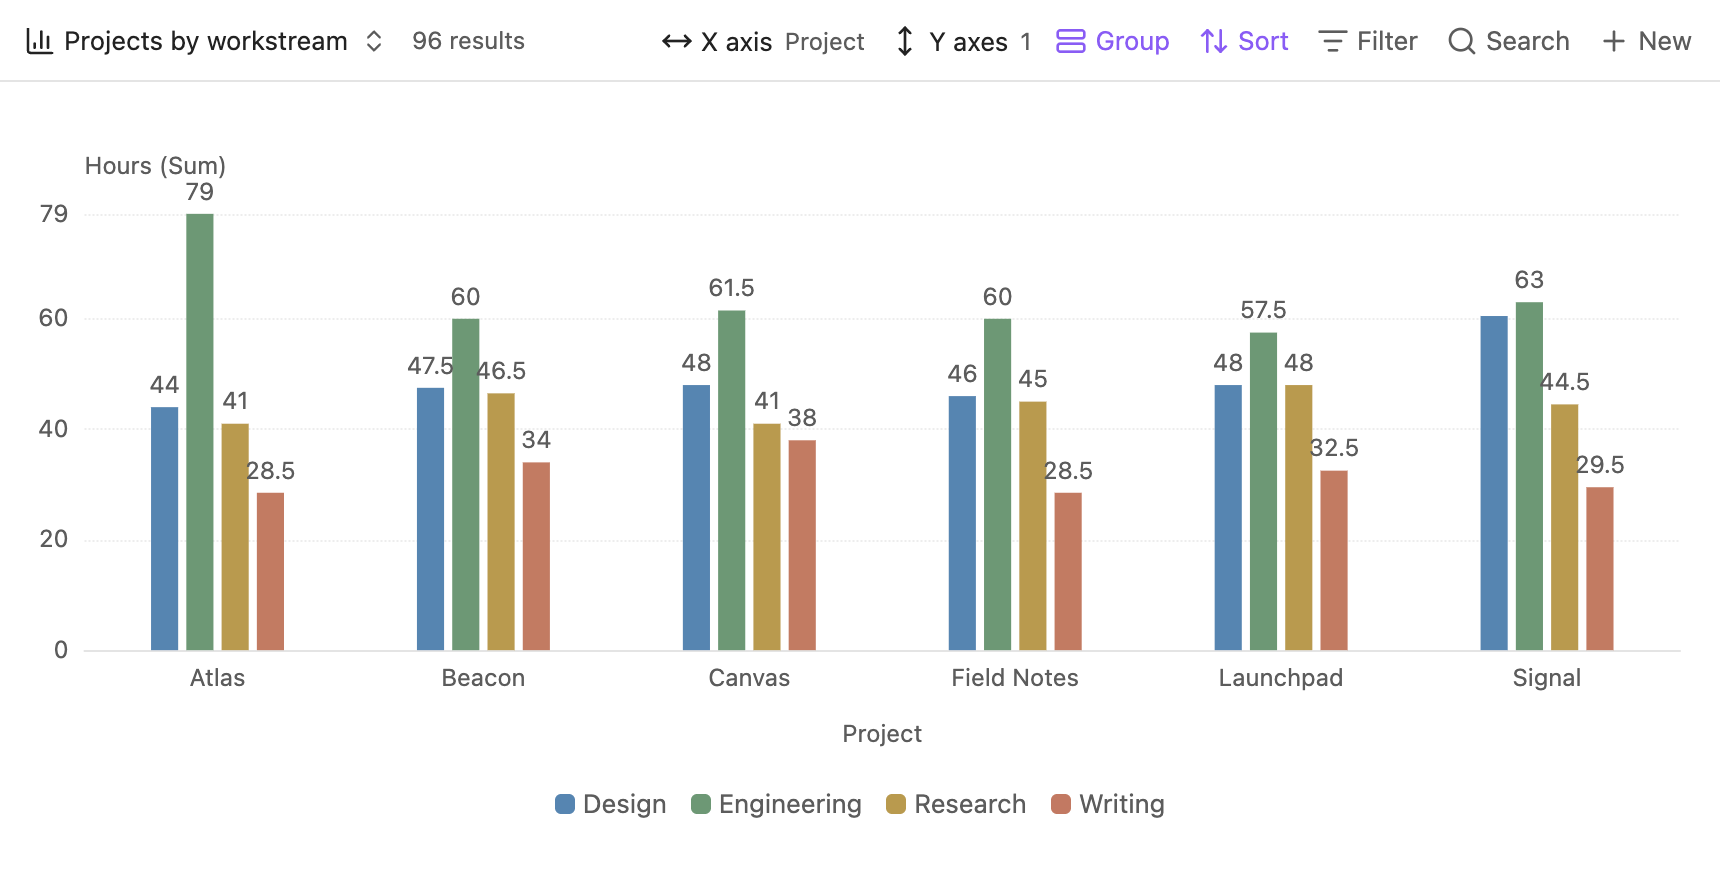
| Chart types | Line, bar, stacked area, pie, radar, and scatter. | Views → |
| Axes and dates | Note properties, file properties, formulas, calendar grouping, and missing dates. | Axes → |
| Groups and aggregation | Bases groups and a separate aggregation for each value property. | Groups → |
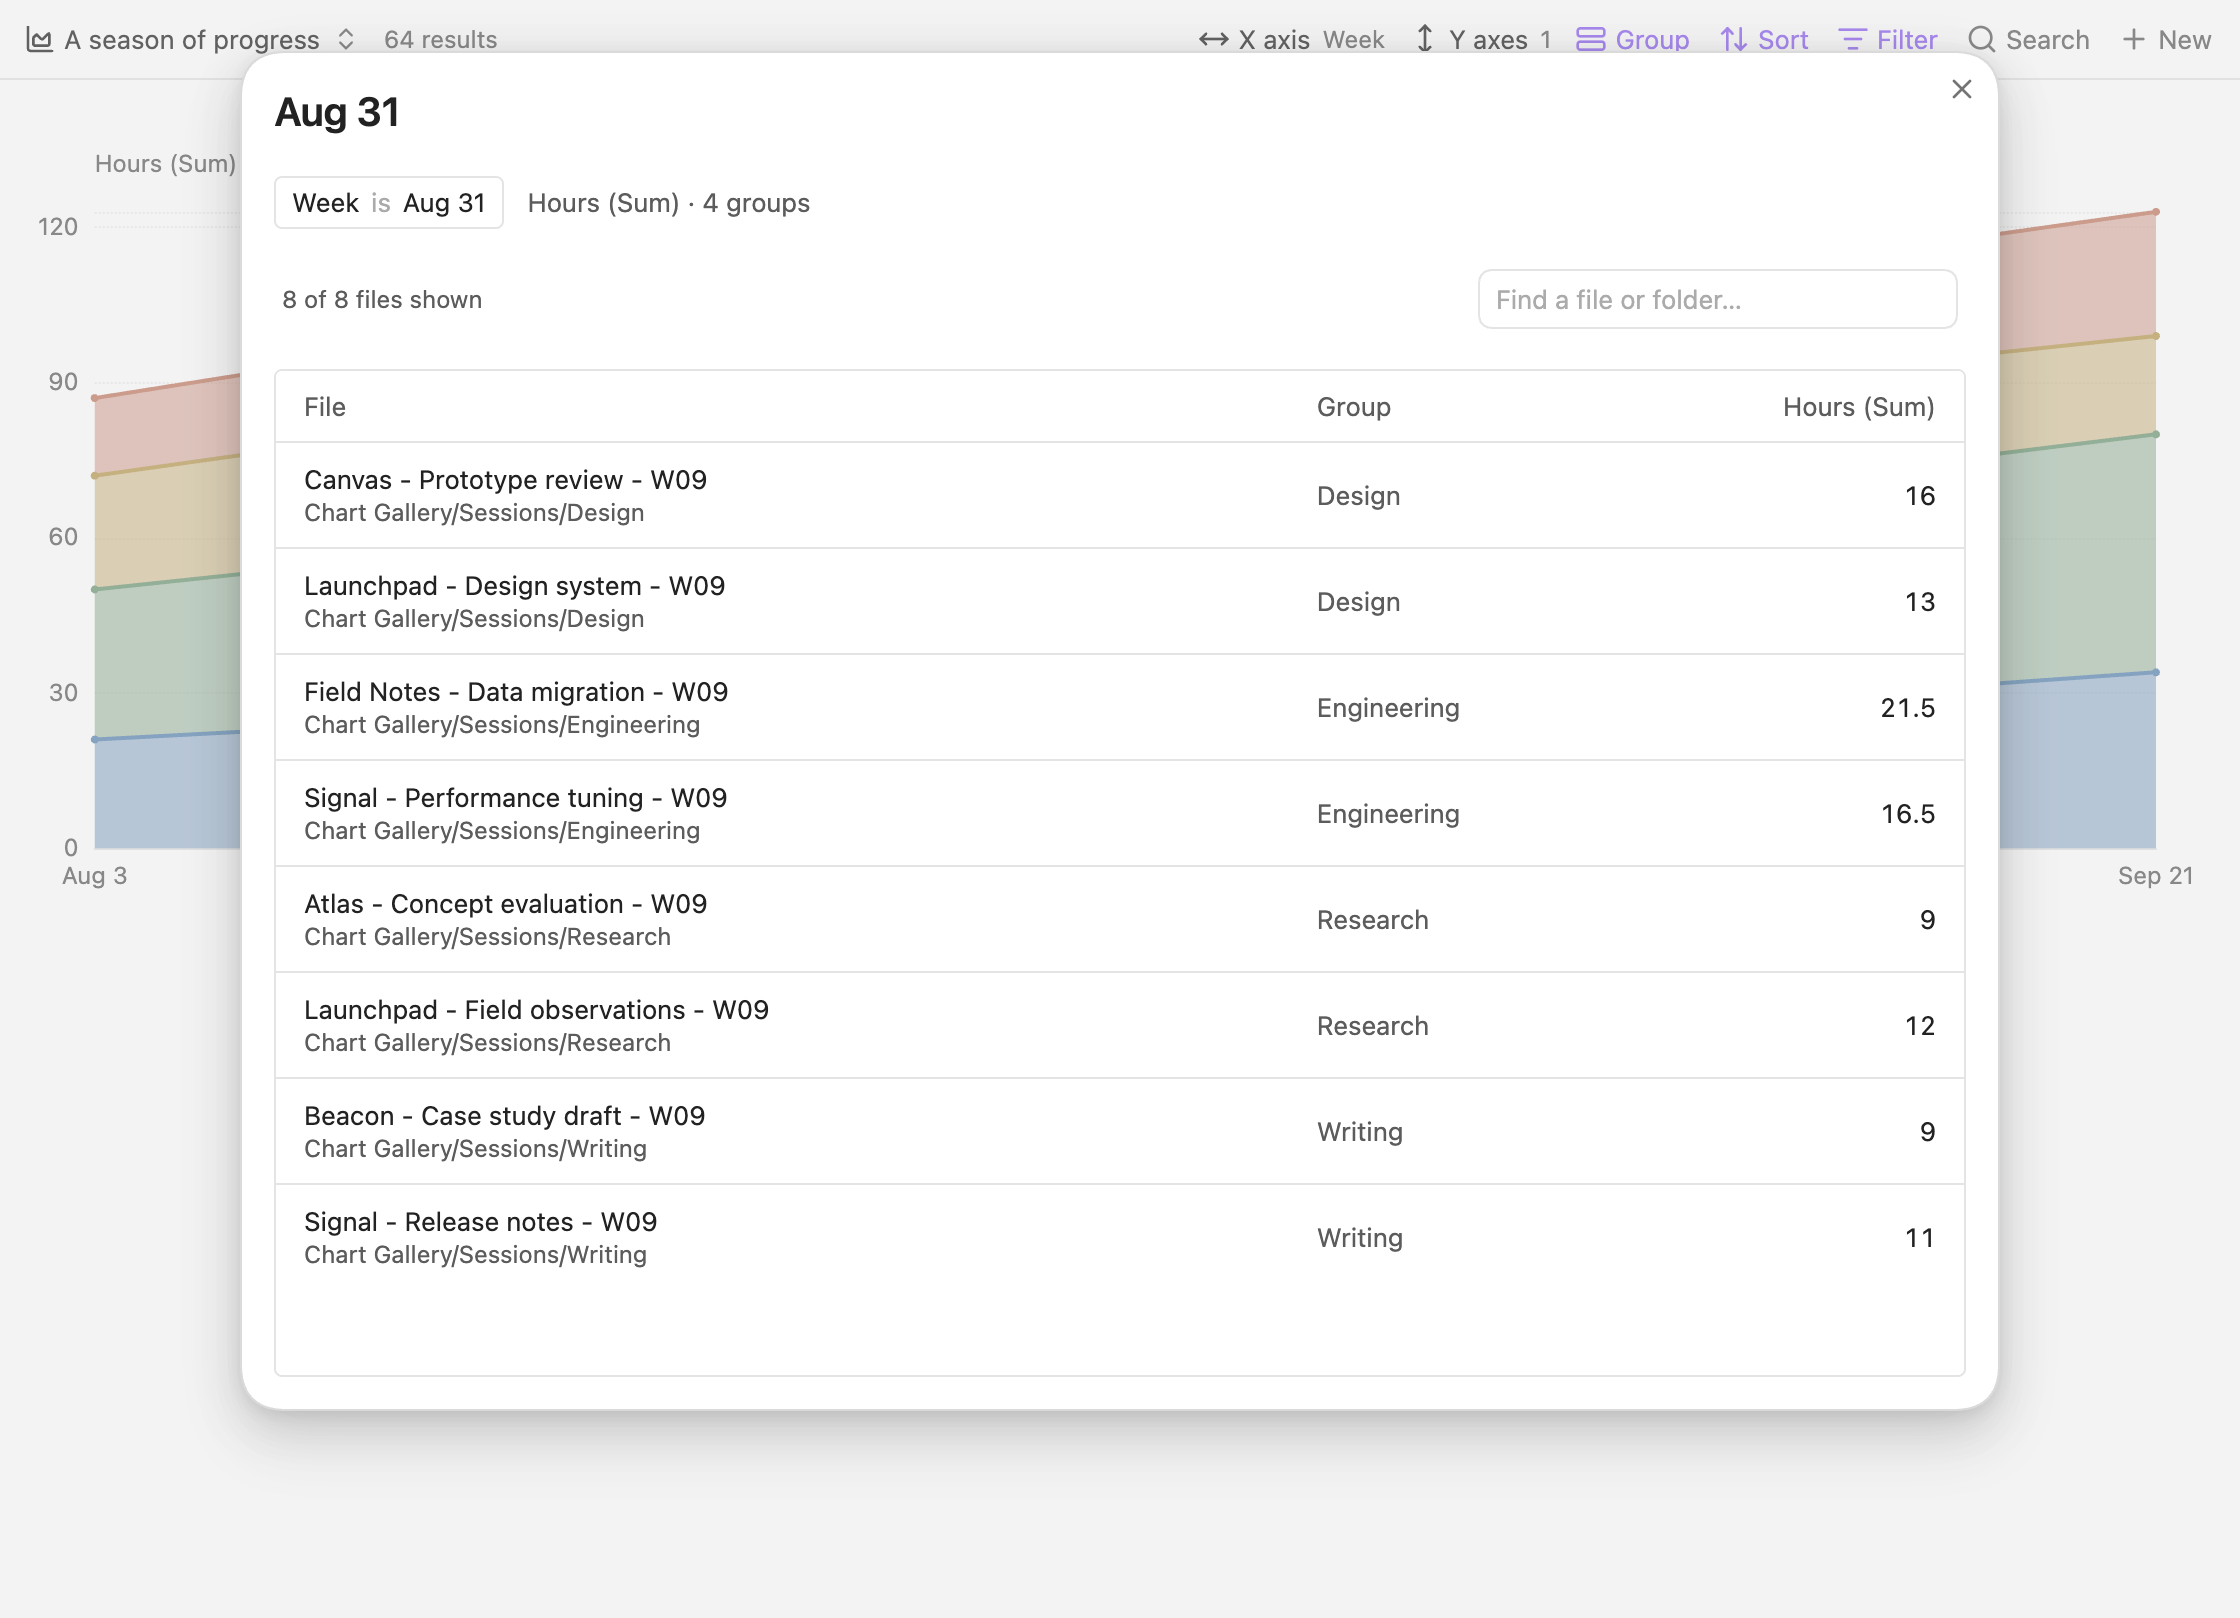
| Data details | A searchable table of the files contributing to a chart value. | Files → |
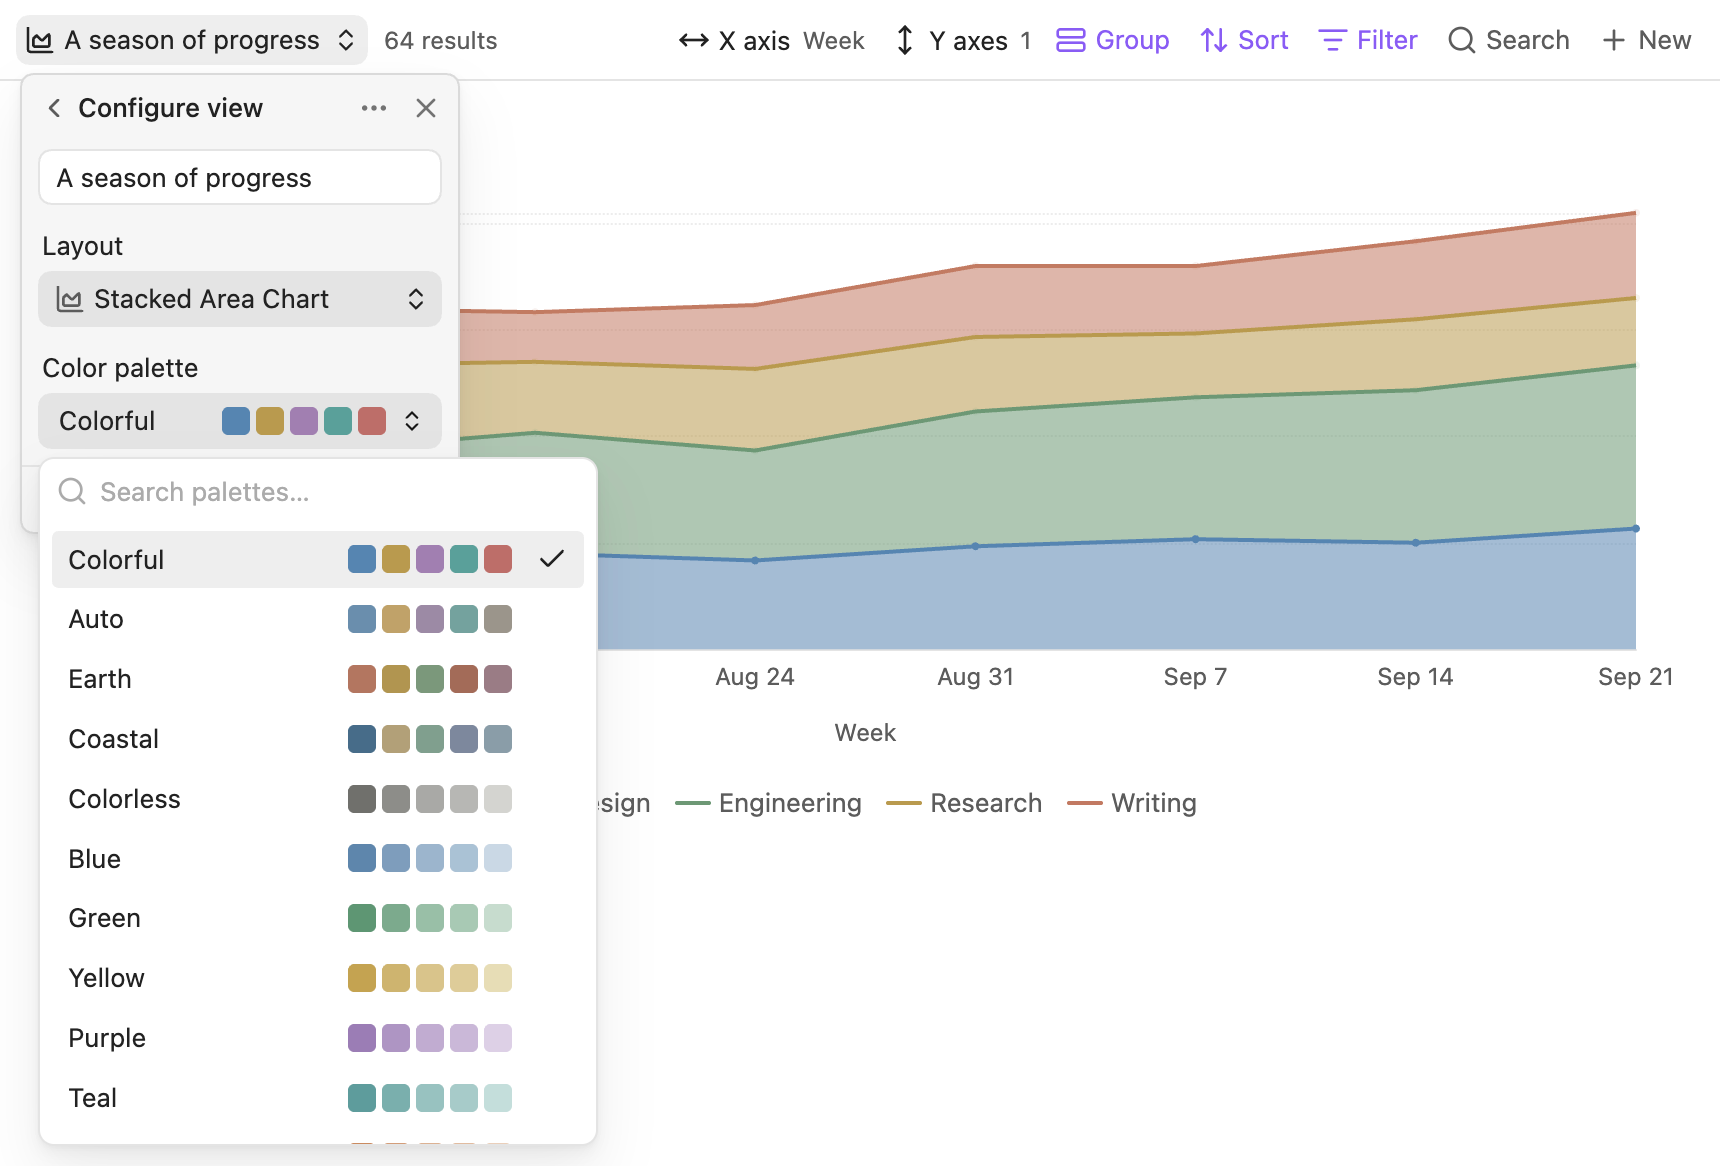
| Appearance | Per-view color palettes and chart-specific display options. | Settings → |
| AI Chart | Saved Apache ECharts options, with Claudian integration. | AI Chart → |
Examples use fictional data.