
Explore the data
Tooltips
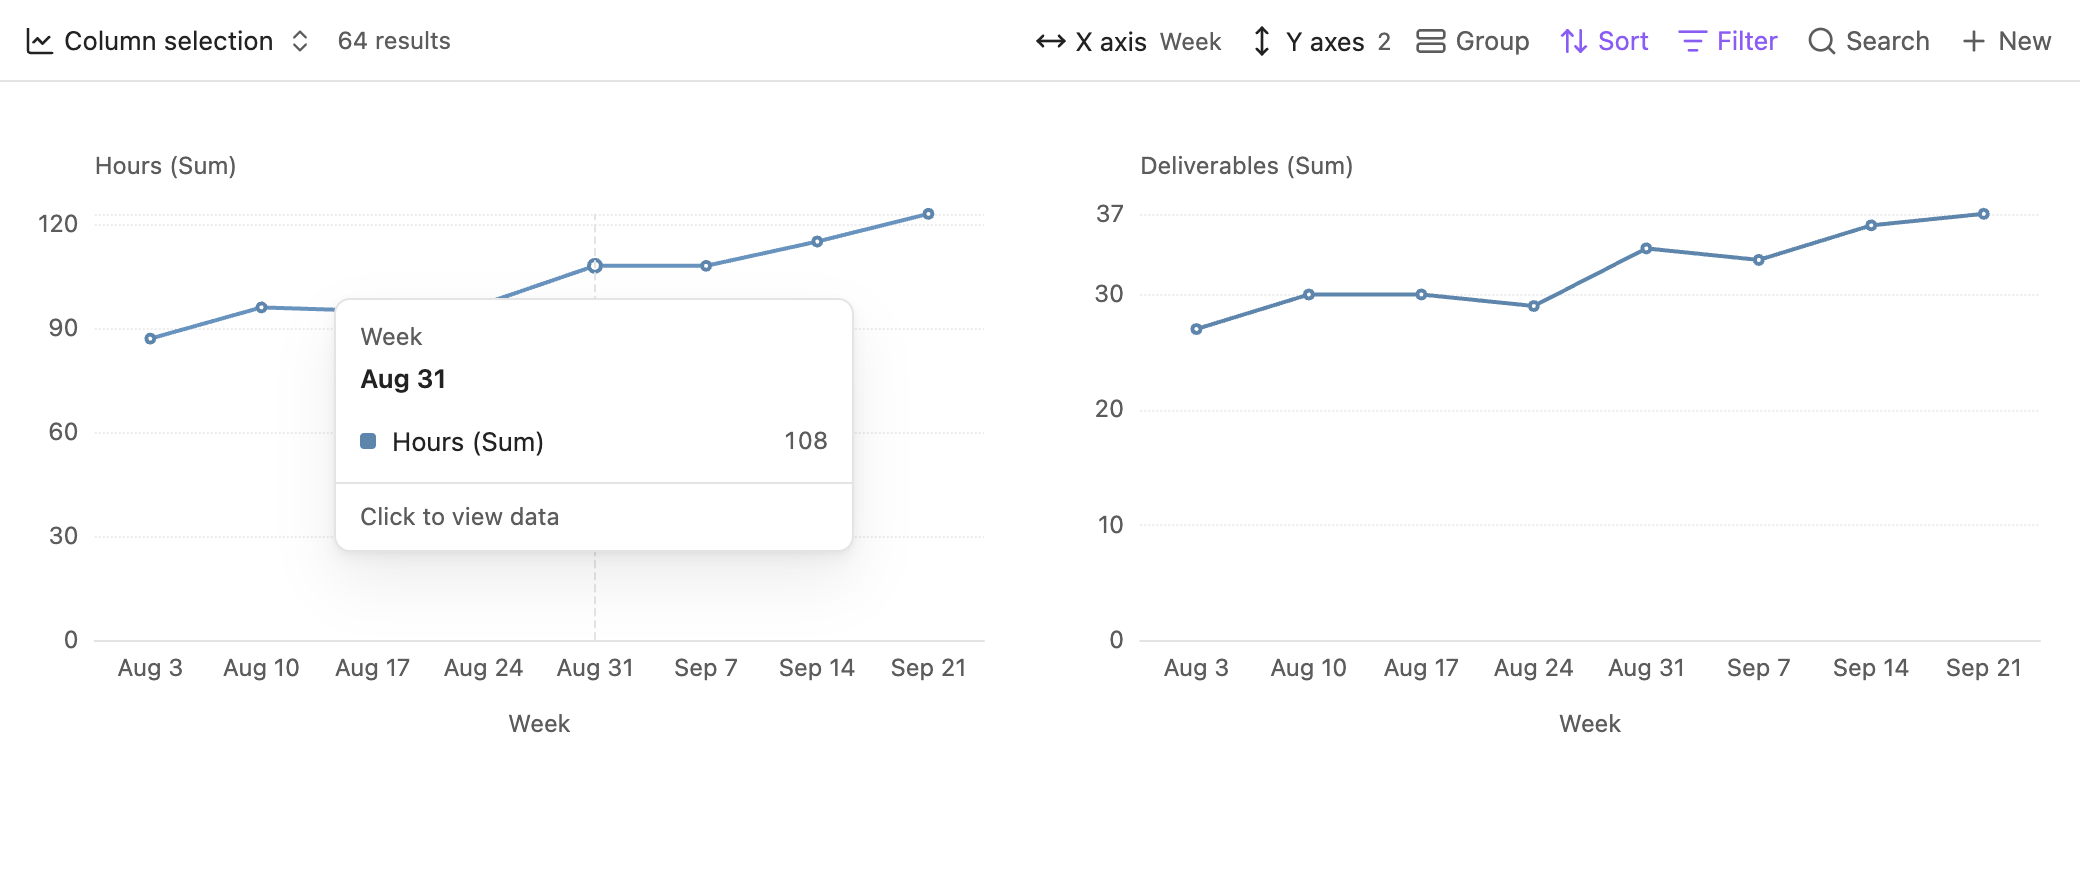
On desktop, tooltips show the X property, selected value, and group totals. Their position is anchored to chart data.
Click the chart to view the source files.
Touch inspection on phones
Portrait phones and foldables up to 1024 pixels wide show a fixed preview below the chart, with an icon and a short hint before the first selection. Tap a chart mark or a supported column to select it, or slide across the chart to inspect different values. The selection stays after you lift your finger.
Tap View data in the preview to open a native drawer with the source files. When a view has multiple measures, the charts scroll while the preview stays in place.
Landscape mobile windows, including unfolded foldables, and portrait windows wider than 1024 pixels use the full chart area without the bottom preview. They use the same anchored tooltips as desktop. Tapping supported chart data opens its source-file details directly. Resizing switches between these layouts without clearing the last phone selection.
Click to view files
On desktop, click the chart itself to open its data table:
When several Line or Scatter points share one column, select the individual point. Single-point columns show a dashed vertical guide and support clicking across the plot height.
On portrait phones, a Line preview combines the groups at the selected X value. Scatter points that share an X value remain individually selectable. The other chart targets in the table also select data for the phone preview.
Read the table
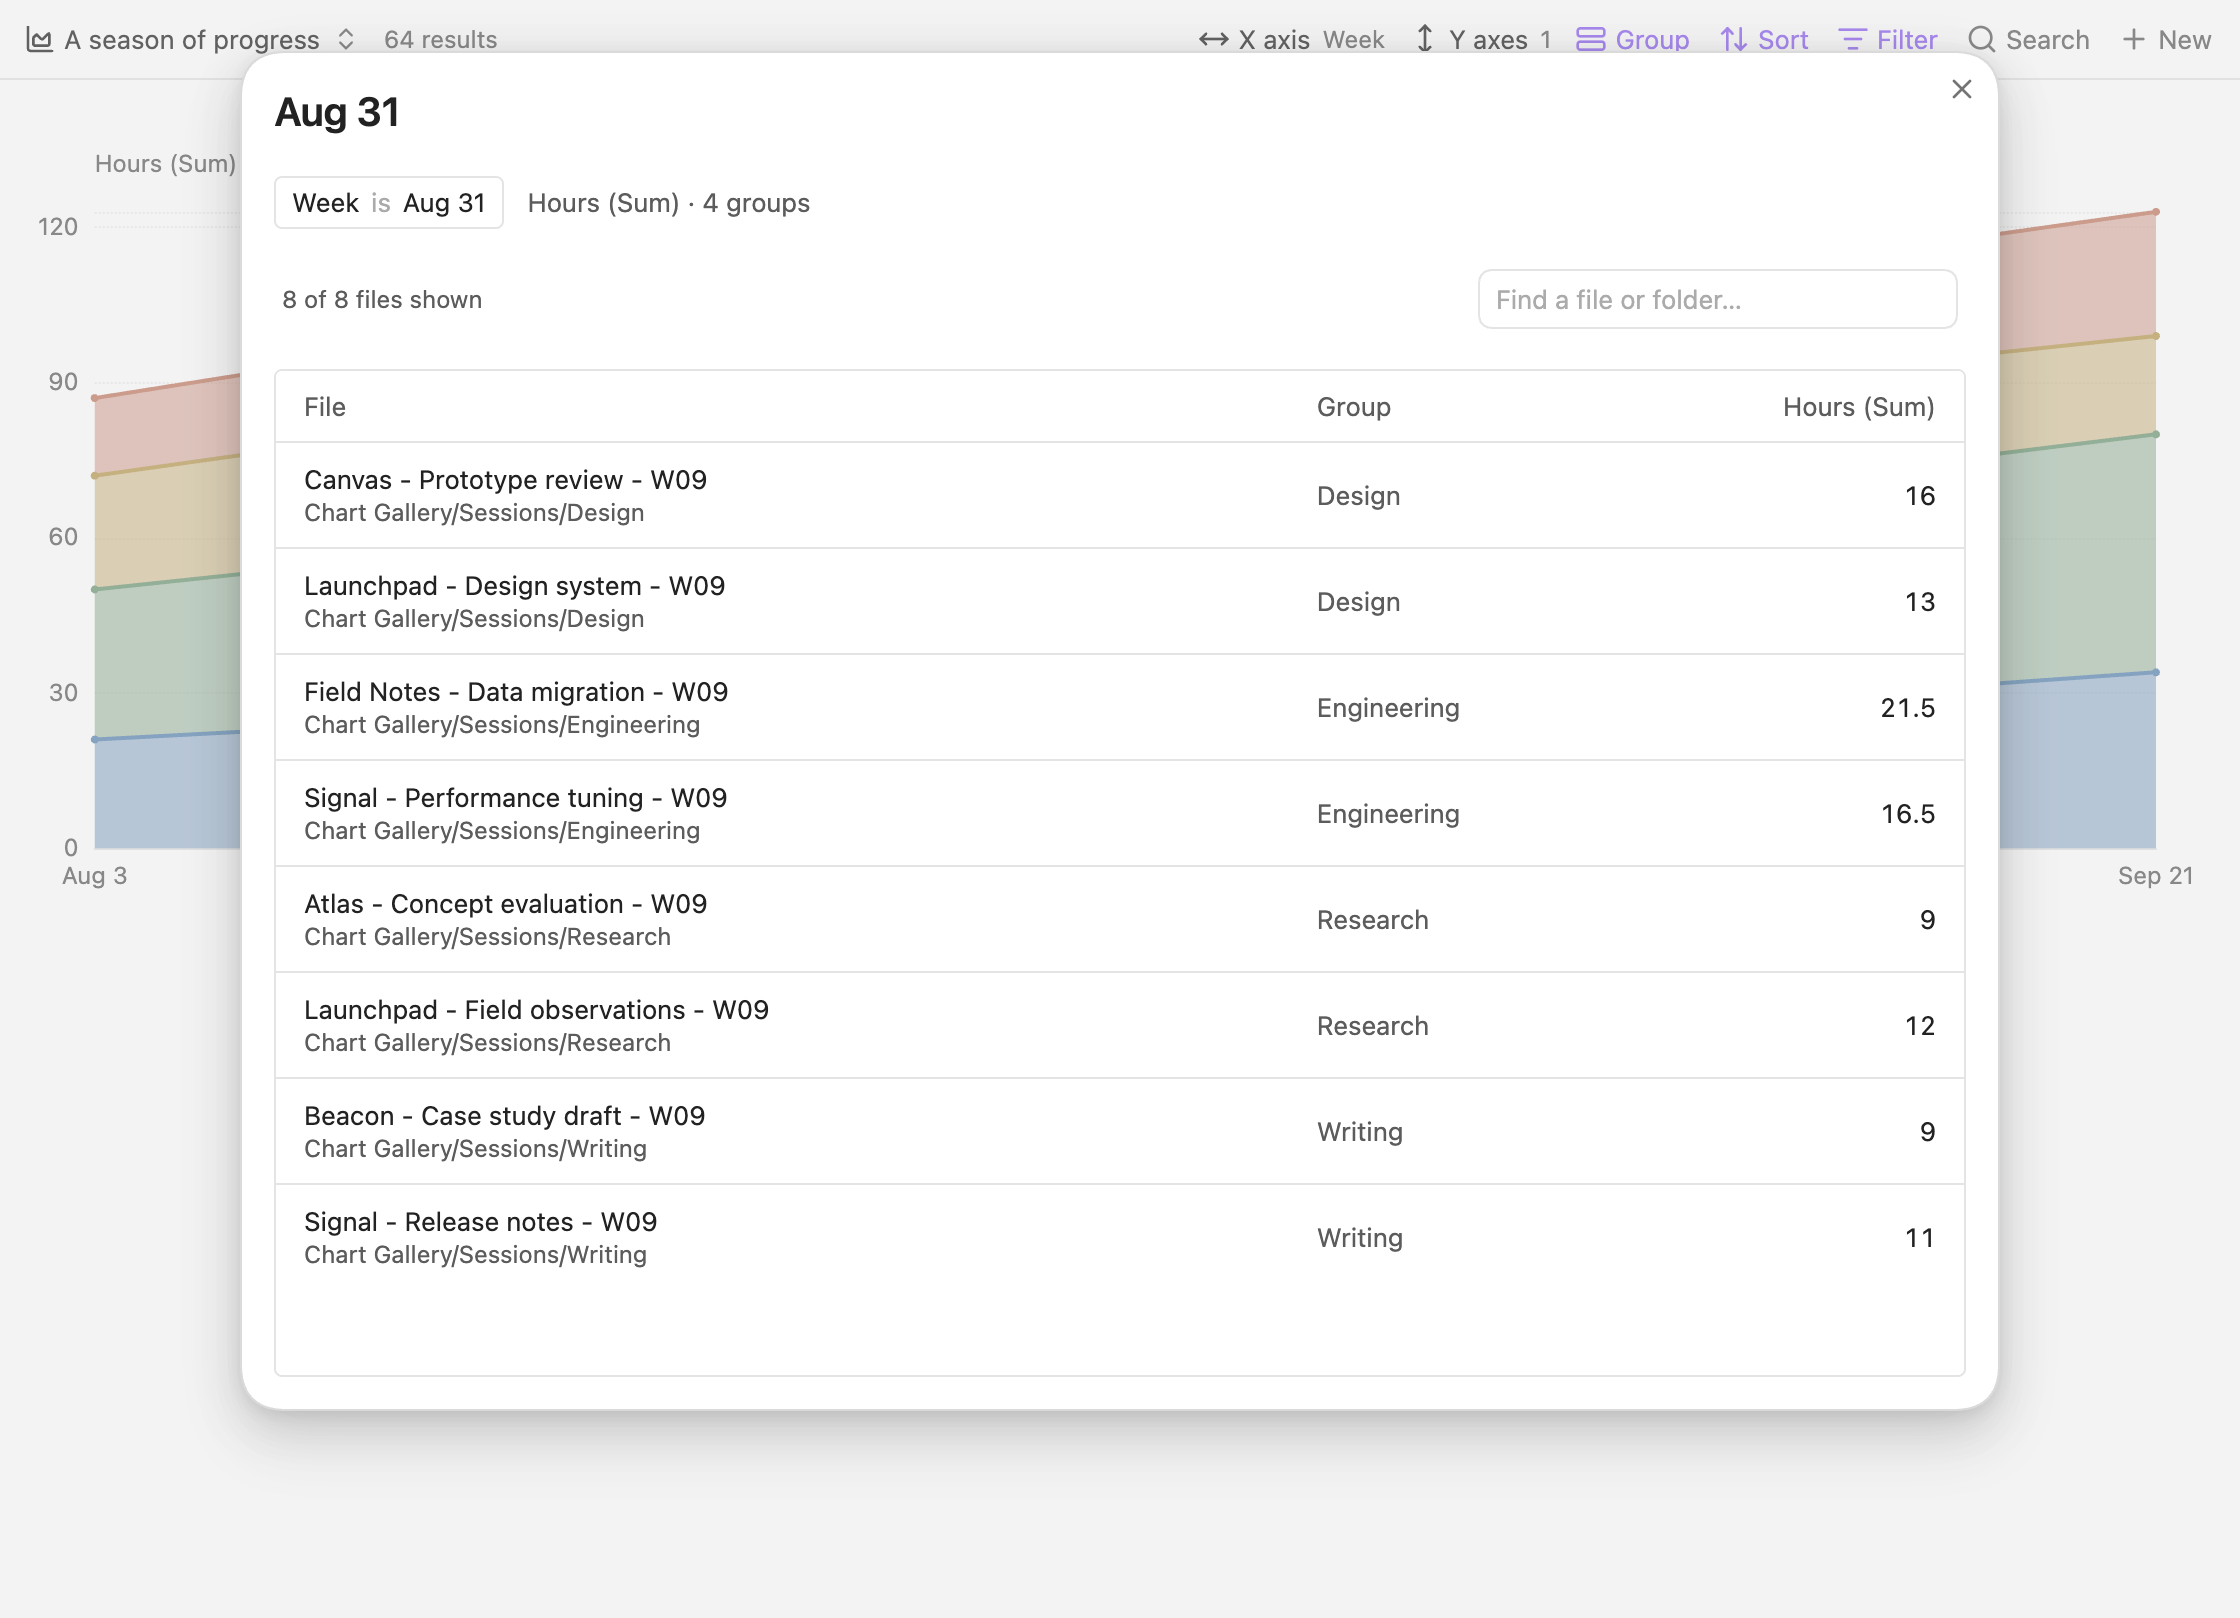
The dialog shows the selected category, its condition, and the aggregate summary above a file table. File names include their folders so identically named notes remain distinguishable. Grouped results can include a group column.
The value in a row is that file's contribution, rather than a repeated copy of the aggregate. Radar's table identifies the categories behind the selected profile.
Search and open
Search by file name or folder path. The search checks the entire result set, including files not yet displayed.
Selections of up to 1,000 files scroll as a single list. Larger selections use Load more to display the next 1,000 files. On narrow mobile screens, group details appear below each file name and values remain on the right.
Click or tap a file row to open its note. Ctrl-click or Cmd-click opens it in a new tab.