
Colors and layout
Color palette
Open the view selector on the left of the toolbar, choose Configure view, then open Color palette.
The picker shows color swatches, supports search, and places the current selection first with a checkmark. Each view stores its own palette in the .base file.
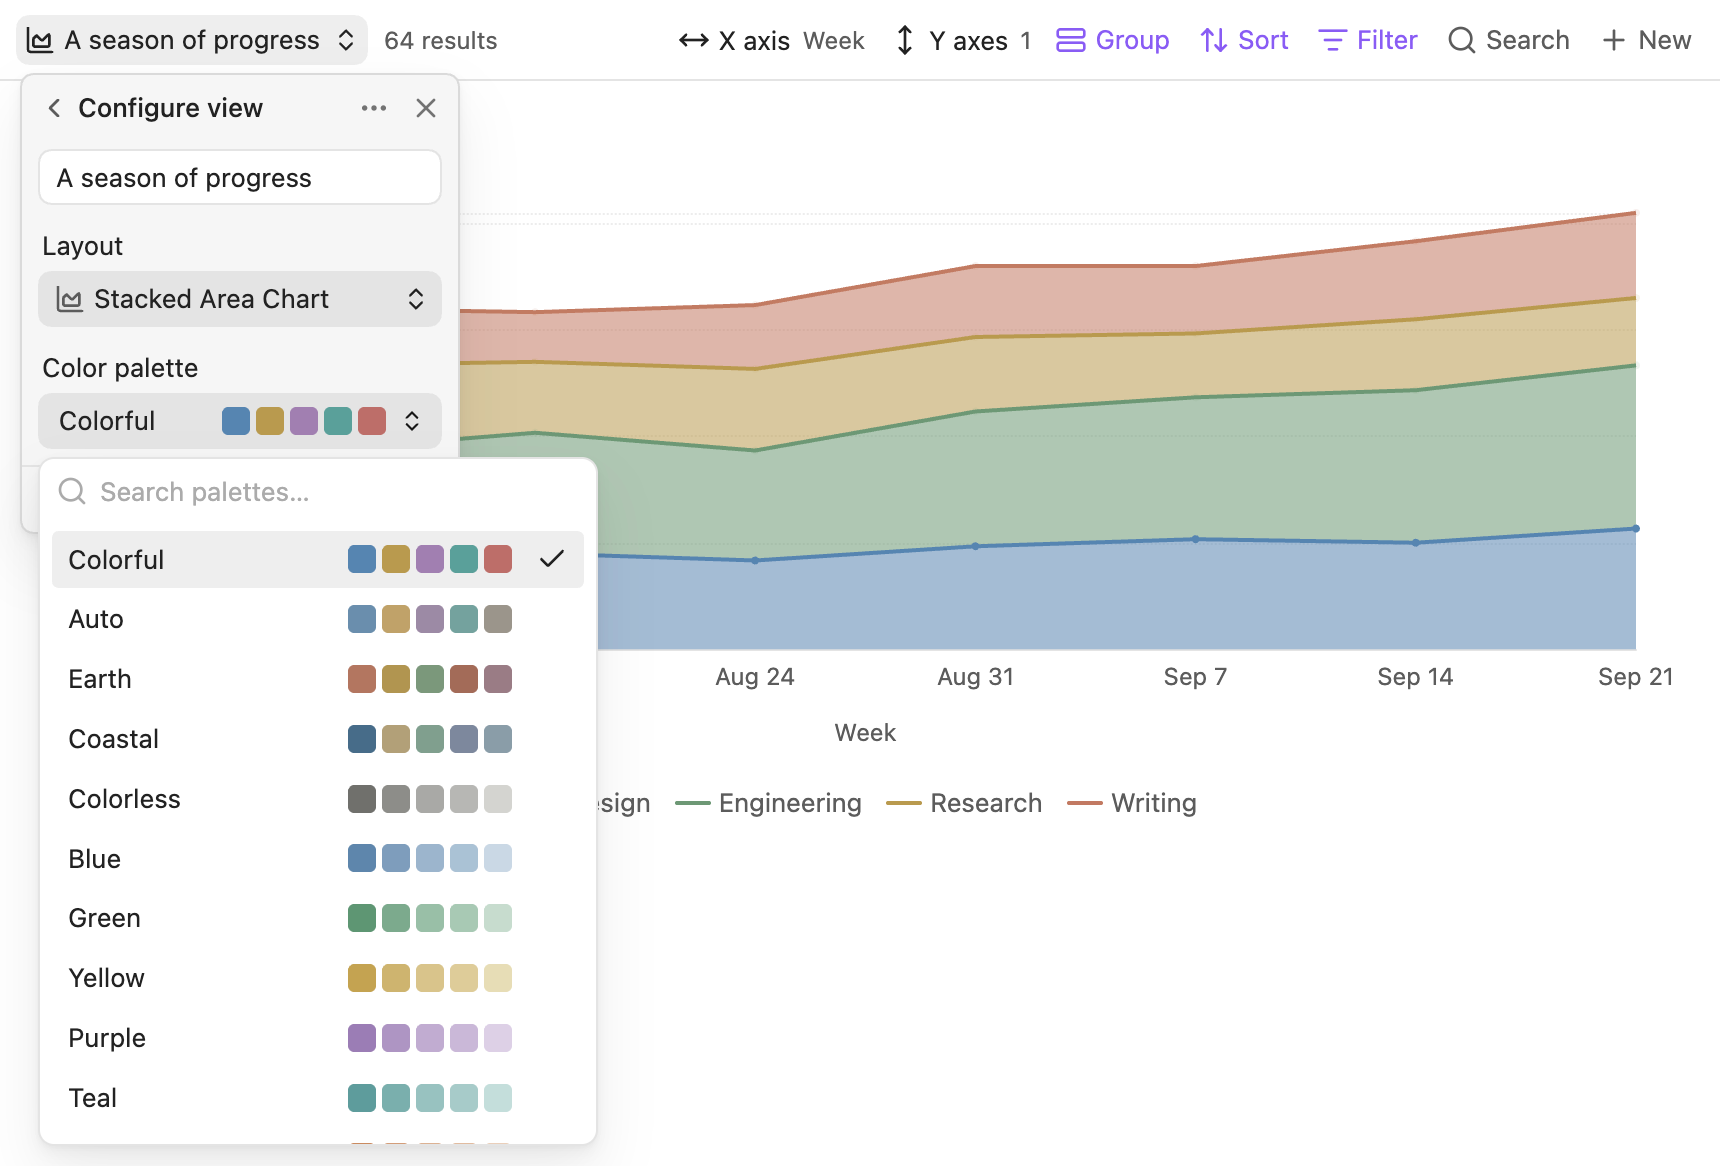
Auto uses the default palette. Mixed palettes assign different hues to groups; single-color palettes use shades of one hue.
Group colors
Click a group in the chart legend to open its color menu. The menu follows Obsidian's Native menus preference and offers these choices:
Automatic and named colors apply immediately. For a custom color, use the picker or enter a hex value such as #5686A5, then choose Apply. Cancel leaves the saved color unchanged.
When any group has a saved color, Reset all group colors appears at the bottom of the menu. It returns all groups to Automatic, including groups currently hidden by filters.
Colors are saved per view and group value. Explicit choices stay the same when groups are reordered or filtered, and when the view palette changes. A hidden group keeps its saved choice when it returns. If the grouping property changes, matching values of the same type keep their colors; text 1 and the number 1 are separate values.
Group color controls remain available when only one group is visible. They appear only in grouped views. In Radar charts with several measures, an explicitly assigned group color applies to all of that group's profiles; line styles and symbols distinguish the measures. Automatic assigns palette colors by profile.
Light and dark themes
Every palette includes light and dark variants. Series keep their hue order when the theme changes. Named group colors also adapt to the theme; custom hex colors retain the exact color you entered. Interface text follows Obsidian's font and theme styling.
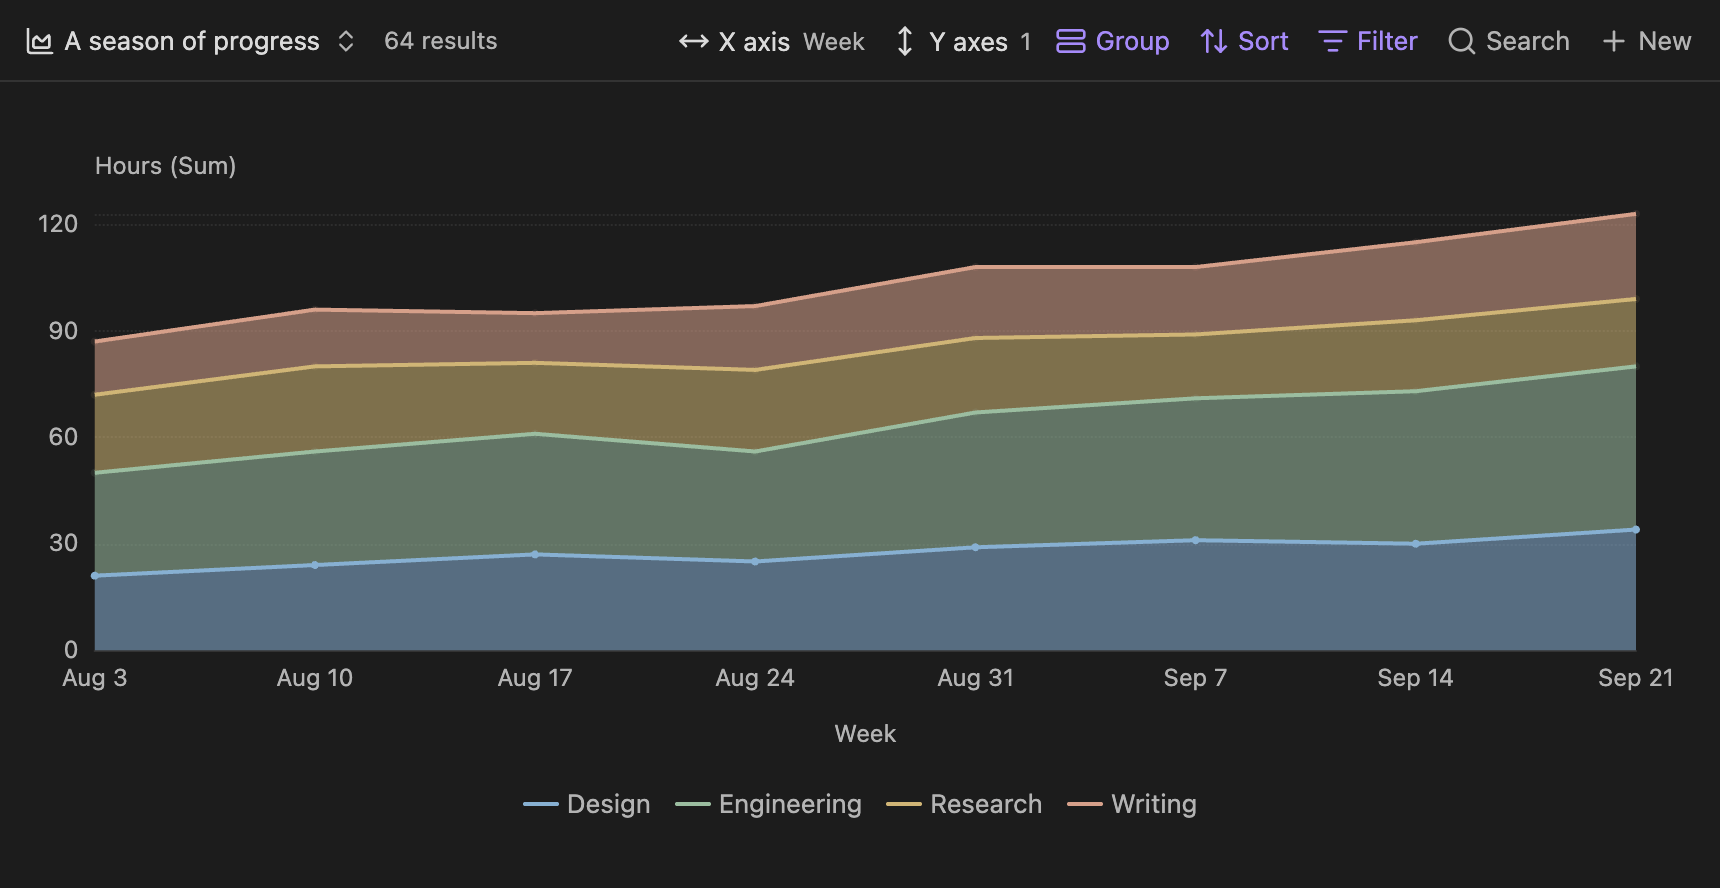
Layout by chart type
Line, Bar, Stacked Area, and Scatter use narrow chart margins below the native Bases toolbar. Pie and Radar are centered in their chart area. Legends sit below charts on desktop and above them on phones.
Selecting several Y properties creates multiple charts in responsive columns. Smaller panes scroll when more vertical space is needed. Radar keeps the selected measures in one chart.
Filters and menus
Native Bases filters limit the records shown in a chart without changing the notes.
The chart controls sit within the Bases toolbar. Standard menus follow Obsidian's Native menus preference.