
Axes and dates
Choose an X property
Open X axis in the Bases toolbar. The selected property appears at the top; search the remaining properties below it.
X supports:
- Note properties, such as
Project,Hours, orCompleted at. - File properties, including name, folder, creation time, and modification time.
- Formulas defined in the Base.
The vault's root folder appears as /. Pie and Radar call this control Category.
Choose Y properties
Open Y axes to add measures. Each selected property has its own aggregation control. Reorder or remove properties from the selected list.
Use numeric properties with Sum, Average, Min, or Max. Use Count for the number of records with a value, including text properties. Scatter also supports None to preserve separate observations.
Pie and Radar call this control Values. See Groups and aggregation for examples.
Date grouping
Date grouping combines timestamps into calendar periods before Y values are aggregated.
- Select the date or datetime property in X axis.
- Open Date grouping for the selected property.
- Choose Day, Week, Month, or Year.
- Set the desired Y aggregation, such as Count or Sum.
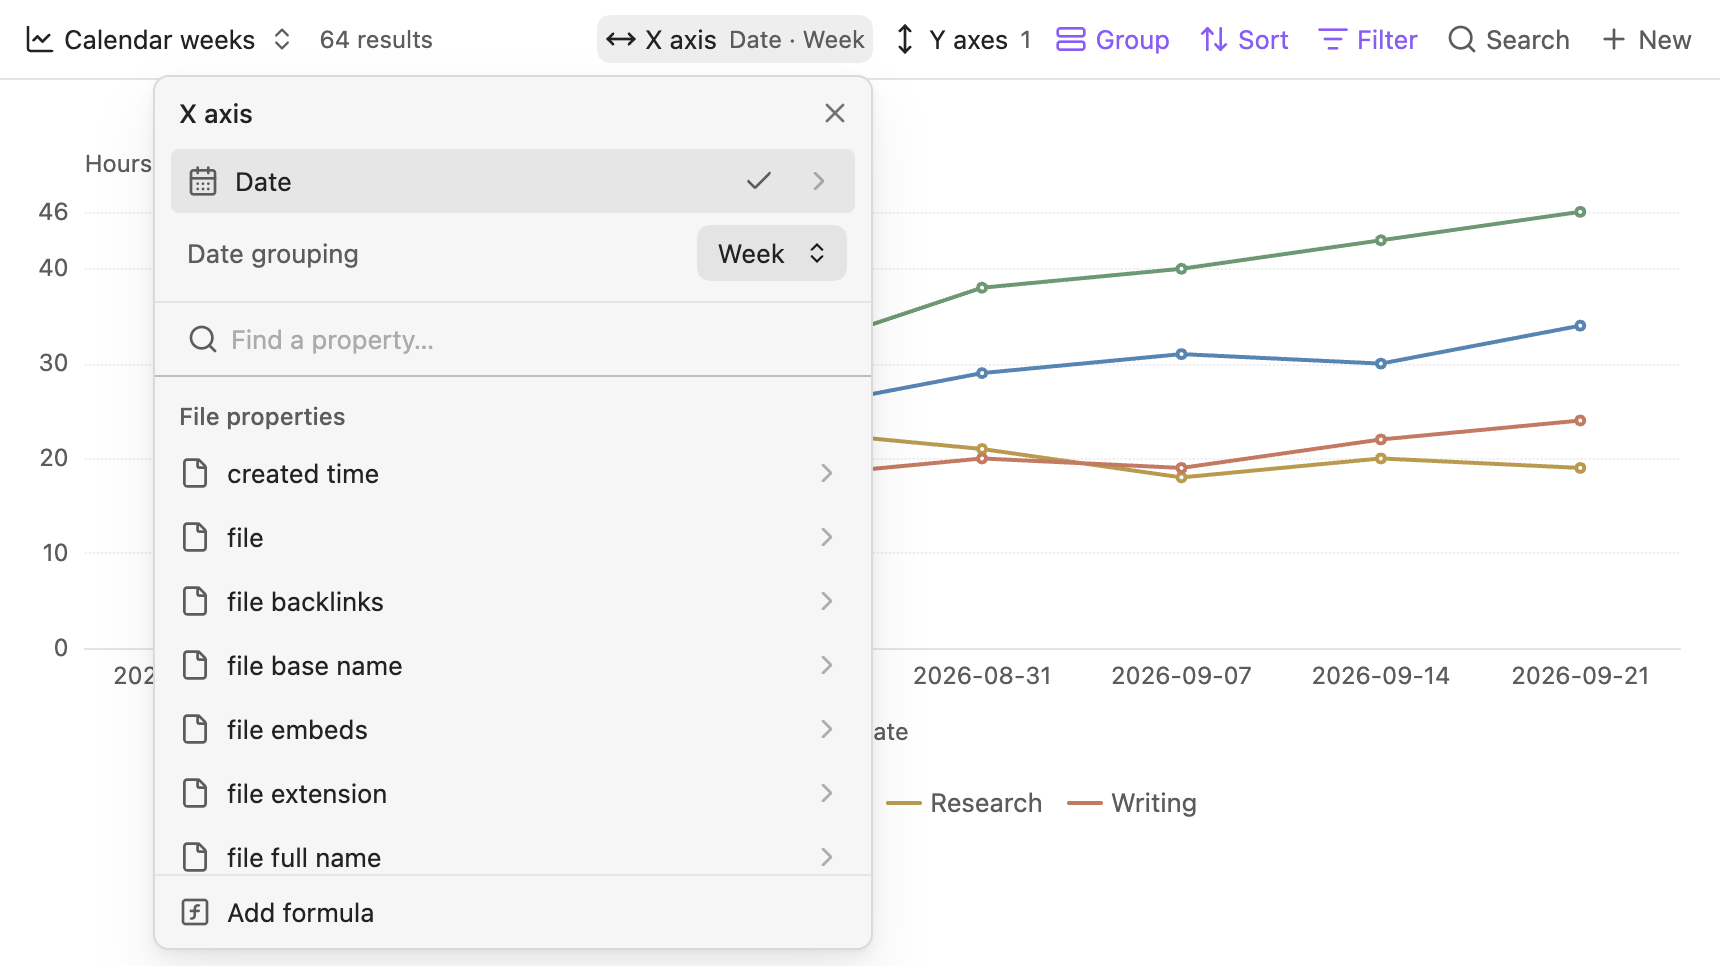
Calendar grouping follows local dates. Timestamps with time zones are interpreted in the local time zone. By default, the X axis includes only periods with values for that chart. Enable Show missing dates to preserve empty periods.
The grouping choice belongs to the selected X property in that view. Changing to another X property does not apply the previous property's calendar grouping to it.
Show missing dates
Line, Bar, Stacked Area, and Scatter can leave space for missing calendar periods:
- Open X axis and select a date, datetime, or date-valued formula property.
- Set Date grouping to Day, Week, Month, or Year.
- Enable Show missing dates, directly below Date grouping.
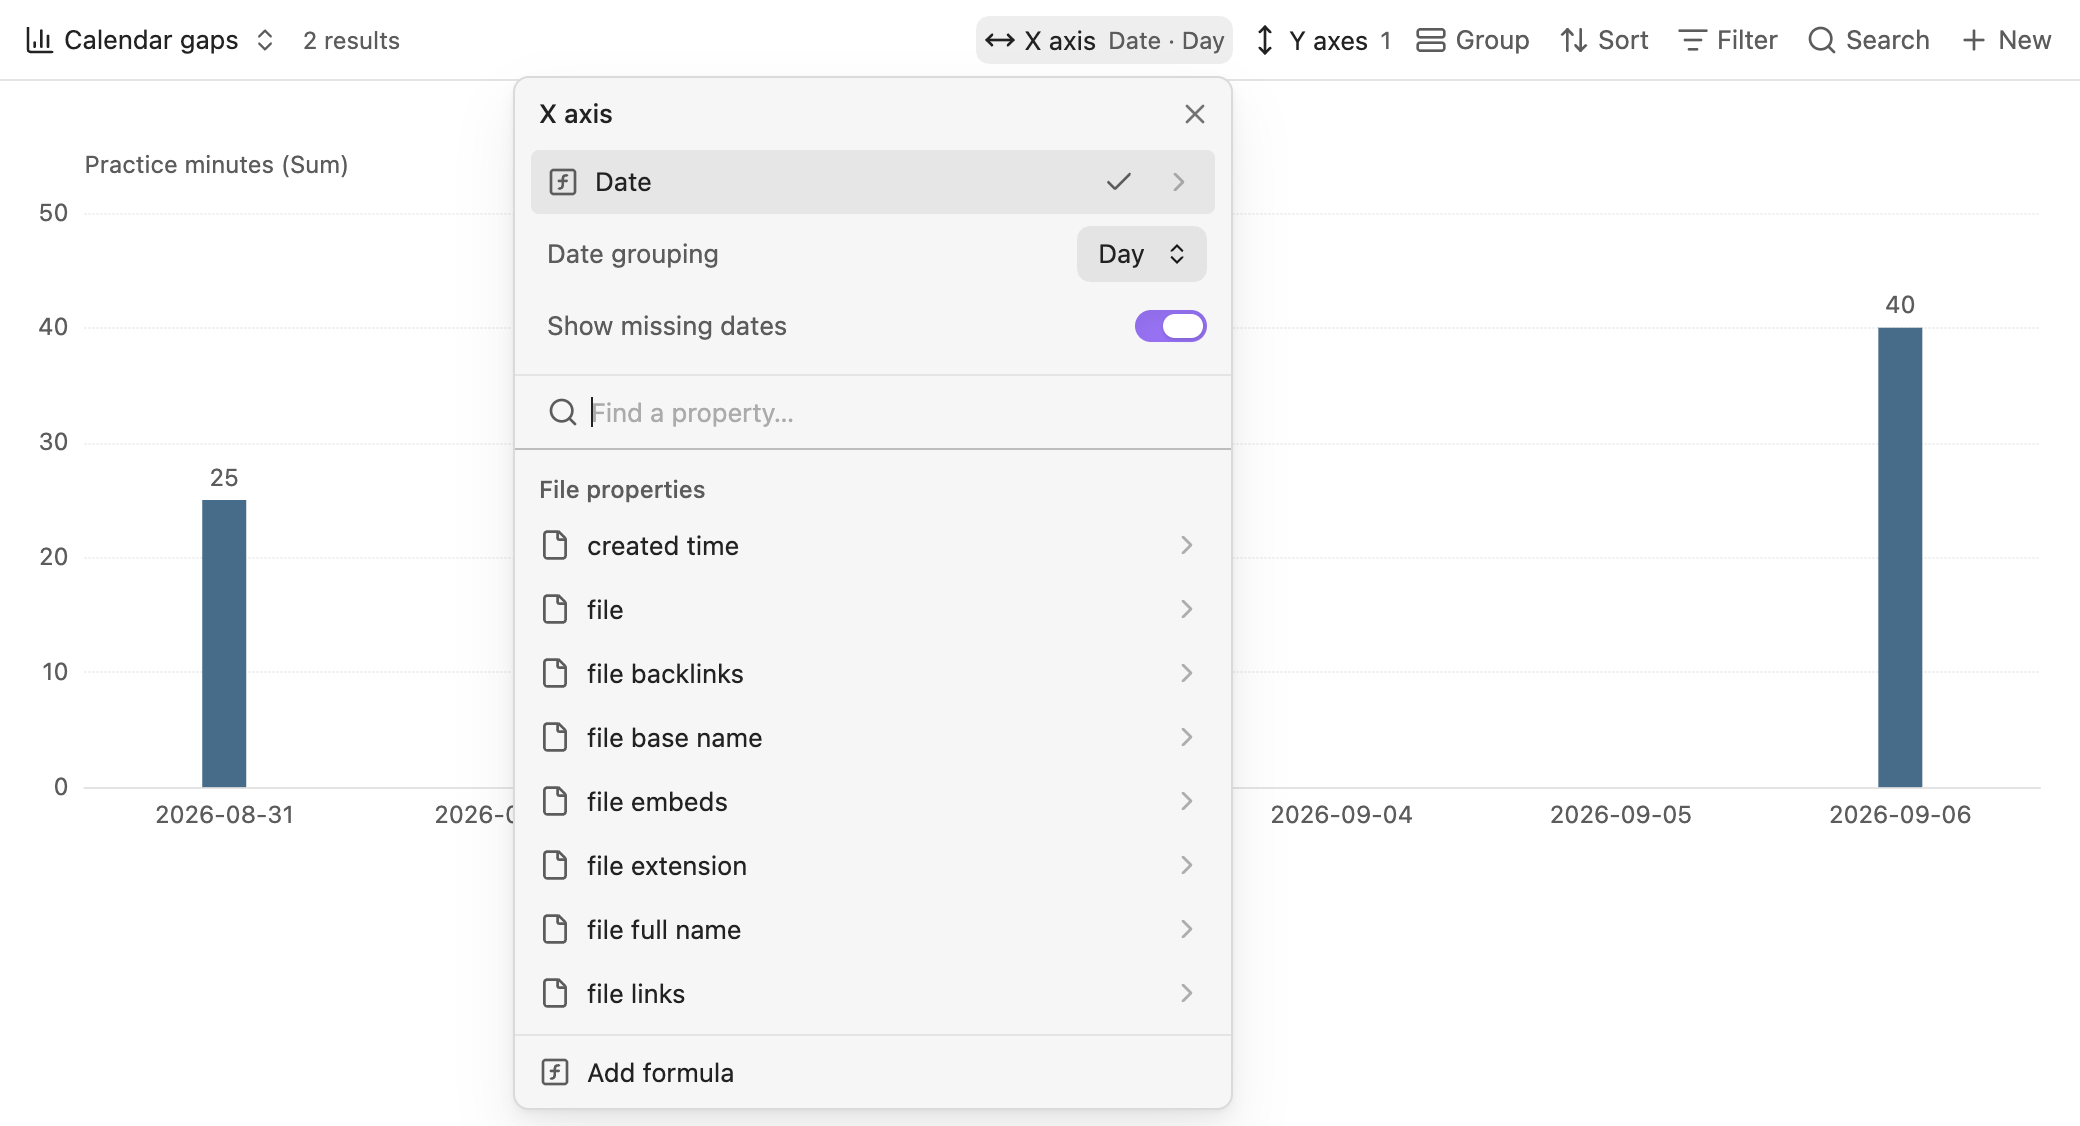
The chart includes every period between the first and last visible dates. For example, if values exist only on August 31 and September 6, daily grouping leaves five empty positions for September 1–5. A note with a date but no value for the selected Y property also leaves an empty position.
Missing periods have no source files or data details. They do not change aggregates or percentages. A recorded zero remains a real value. In Line charts, Gap handling → Leave gap breaks the line across missing periods; Fill with 0 explicitly draws them at zero without creating source records.
The range follows the Base's filters and visible groups. It does not extend to today or beyond the first and last visible dates. A descending sort on the X property reverses the timeline. The toggle is off by default and is saved for the selected X property in each view.
Exact time retains individual timestamps without defining a calendar interval, so Show missing dates is disabled in that mode. To keep the chart responsive, a range exceeding 10,000 periods displays a message asking you to choose a larger grouping or turn the toggle off.
Daily note filenames
For daily notes named YYYY-MM-DD, add a formula such as:
Select that formula as X, choose Day, and enable Show missing dates. Keep the formula date-valued; formatting it as text with .format() removes its date type.
Formulas and property editing
Click a property's name to select it. Use the arrow at the right of its row to open Obsidian's native property editor.
Add formula opens the native formula editor with completion and validation, when that editor is available in your Obsidian version. After a valid new formula is saved and you leave the editor, the chart selects it. Back returns to the axis picker you came from.
For ordinary daily, weekly, monthly, or yearly grouping, use Date grouping directly. A formula is useful when you want a different calculation or label, such as an amount converted to another unit.
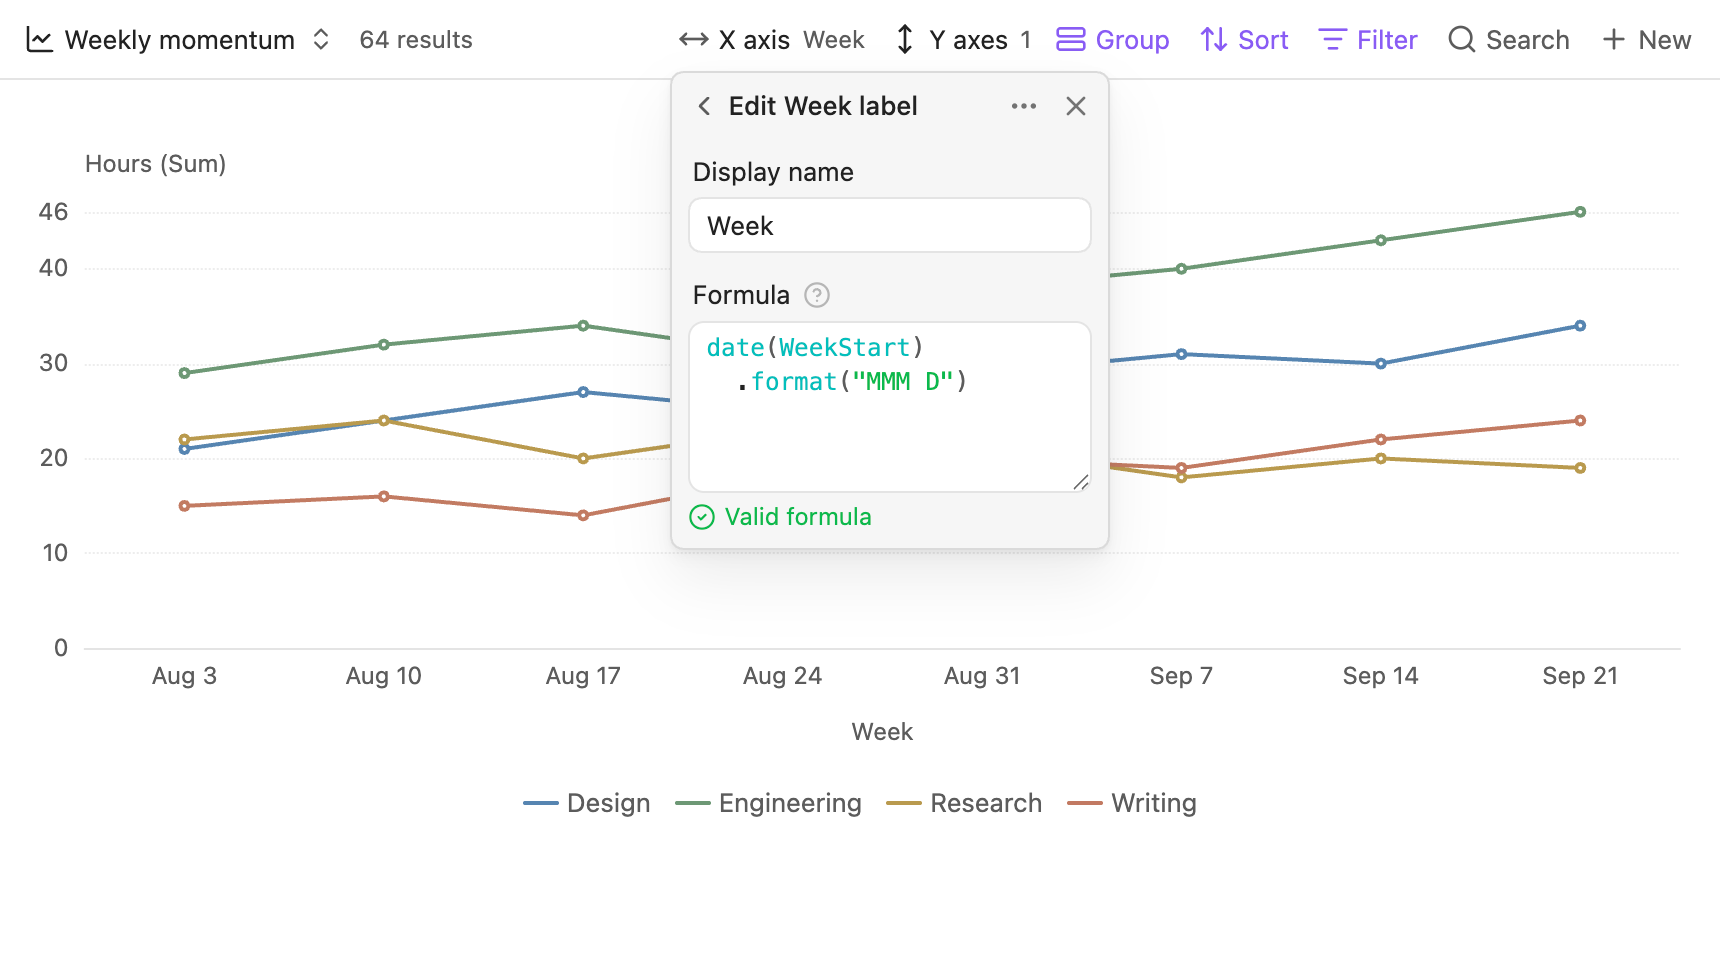
The gallery uses date(note.WeekStart).format("MMM D") to give an existing week-start property a compact label. A formatted label is text: keep the Base sorted by WeekStart to preserve chronological order. Use native date grouping when the original timestamps need to be combined into periods.
Sorting
Use the native Sort menu to arrange category values through the Base's result order. Calendar buckets are sorted chronologically. A descending sort on the selected date property reverses that timeline.
Y scale
For Line, Bar, Stacked Area, and Scatter, open Configure view → Y scale:
- Sync across charts shares bounds across the selected Y-property charts.
- Min Y override fixes the lower bound.
- Max Y override fixes the upper bound.
Bar's 100% Stacked layout uses a fixed 0–100% scale and hides these controls. Switching back restores the saved scale settings.
Leave an override empty to let the chart determine it. Compare like units when synchronizing scales. Pie has no Cartesian Y scale; Radar has its own scale setting.