
Overview
Bases Chart Views adds six Data Chart types and an AI Chart view to Obsidian Bases. Charts use Apache ECharts.
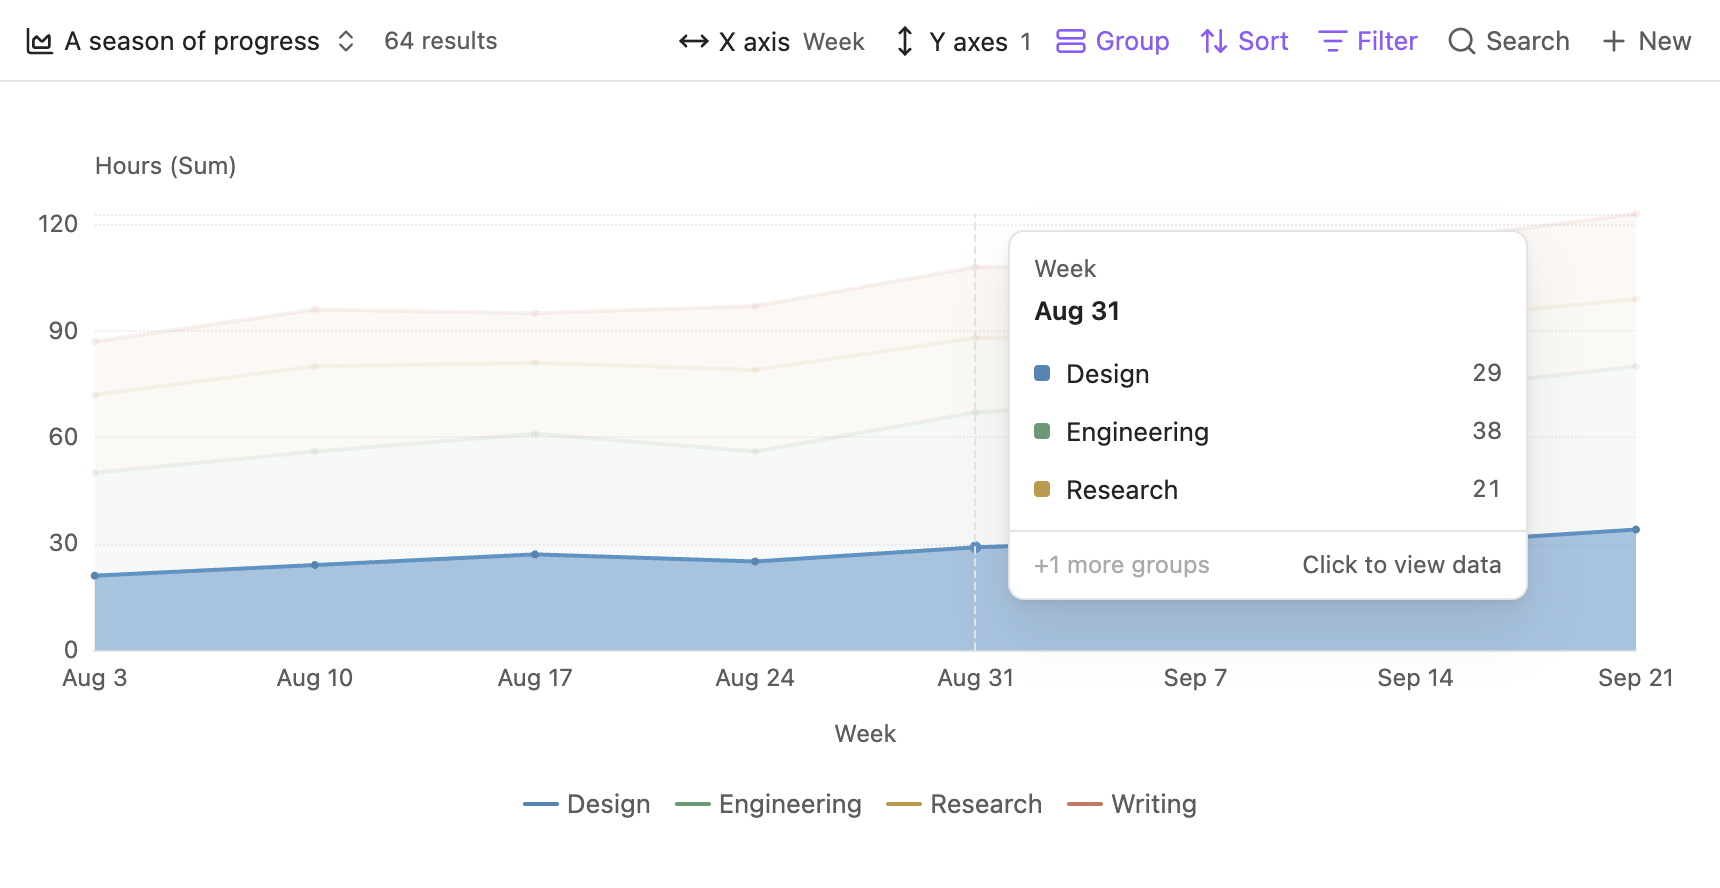
Data Charts and AI Chart
Your first chart
- Install and enable the plugin.
- Create or open a Base containing the notes you want to chart.
- Add a view and choose Bar Chart.
- Open X axis and choose a category property, such as
Project. - Open Y axes, add a numeric property such as
Hours, and choose Sum. - Click a bar to inspect the files contributing to its value.
To count notes instead, add file name as the Y property and select Count. Text properties need Count to produce a numeric result.
Controls
Pie and Radar label their controls Category and Values. The AI Chart toolbar only shows its view selector because the saved ECharts option defines its data and appearance.
View configuration
Add several views to one Base: a line for change over time, bars for category comparisons, and a donut for composition. Axis selection, date grouping, missing-date display, aggregation, bar layout, palette, and group colors are saved with each view in the .base file.
Chart types · Axes and dates · Groups and aggregation
These docs cover Bases Chart Views 1.3.1. See release notes for changes in this version.