
Chart types
All six Data Chart views read the Base's filtered results and support per-property aggregation.
Line, Bar, Stacked Area, and Scatter support Show missing dates for calendar-grouped X axes. This preserves empty days, weeks, months, or years between the first and last visible dates.
Line
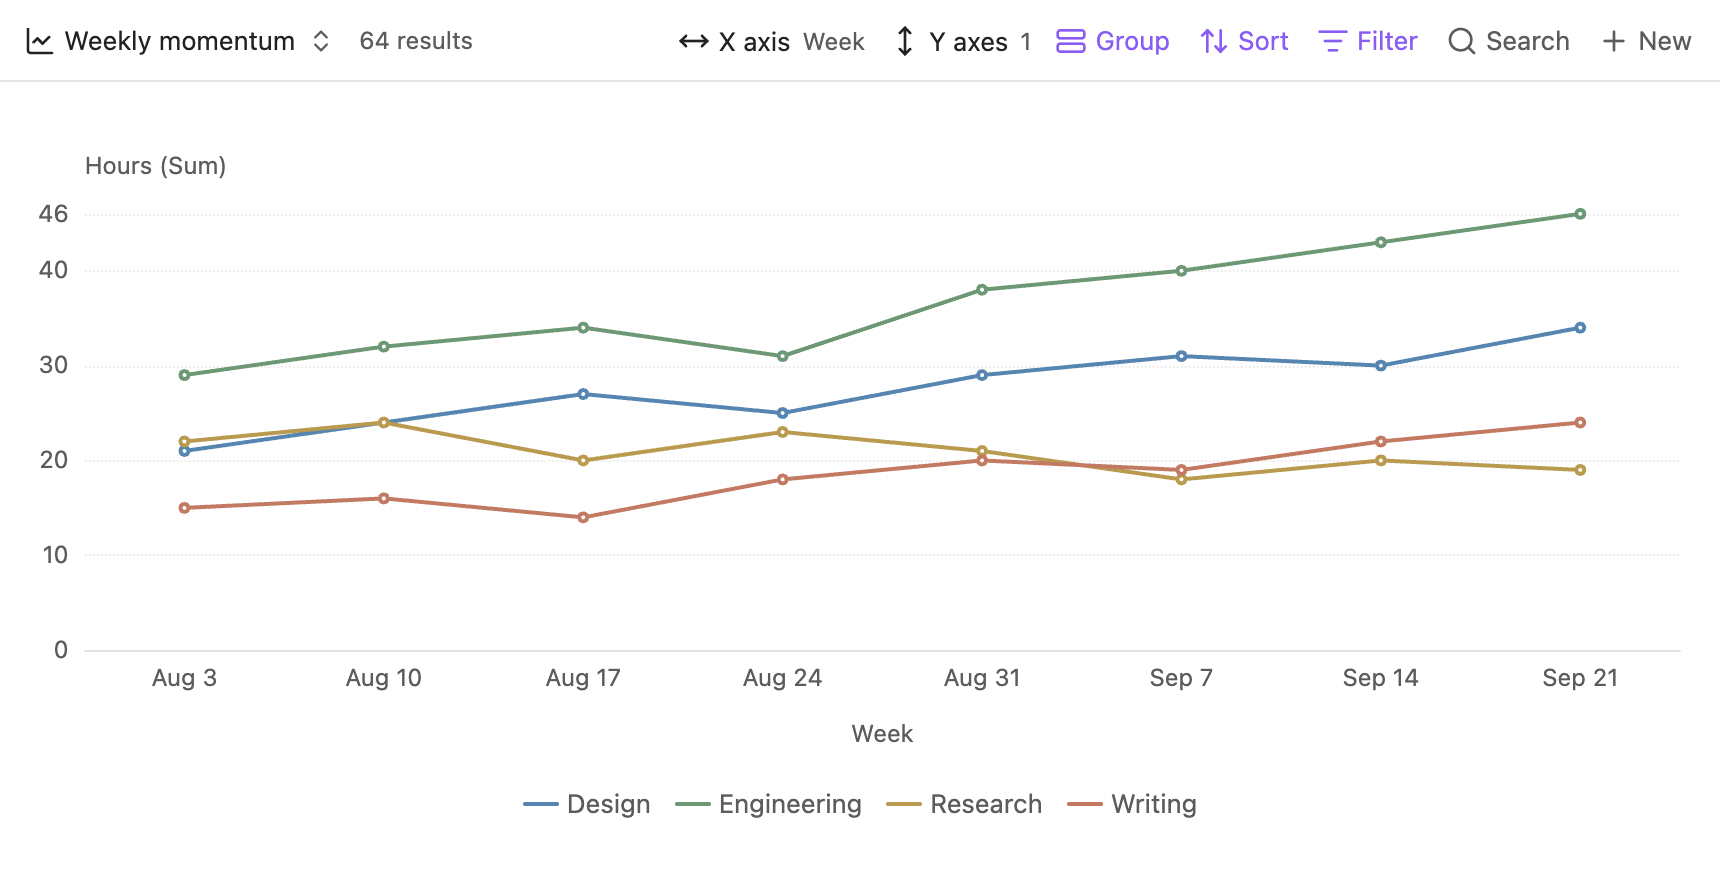
Use a line chart for a date, numeric, or category axis. Date grouping combines timestamps into calendar periods before aggregation.
In Configure view, Gap handling offers Leave gap and Fill with 0. Choose zero only when a missing value should mean no activity.
Bar
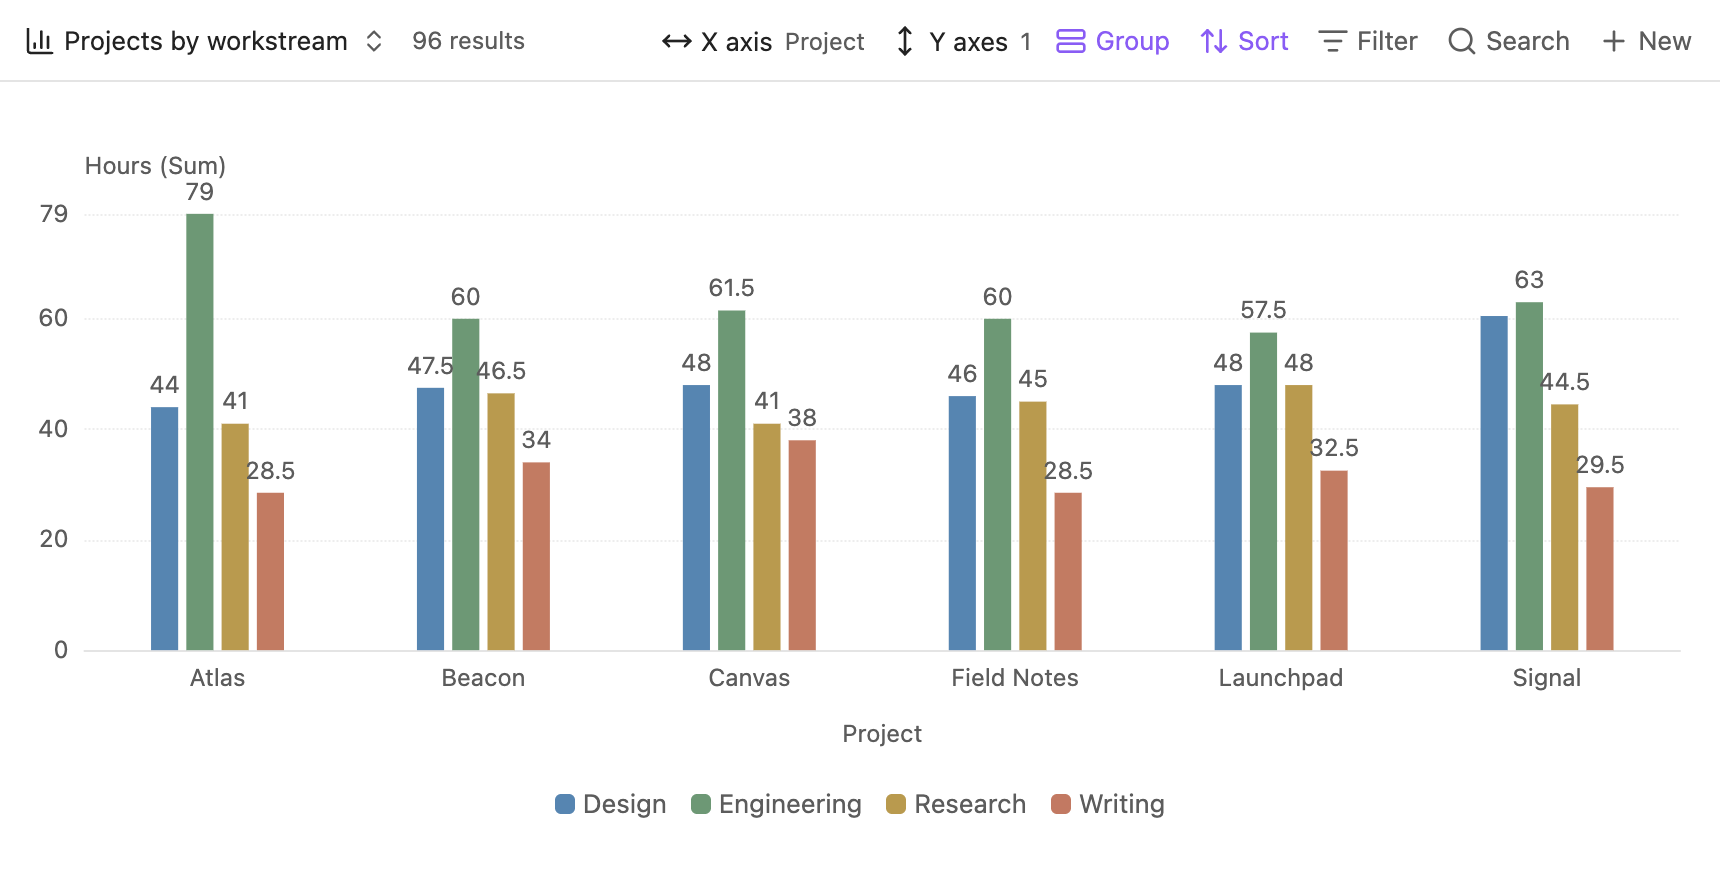
Choose Bar layout in the native view settings:
Show labels places values above grouped bars and inside stacked segments. Labels that cannot fit inside a segment are hidden; hover or touch the column to inspect all values.
100% Stacked requires non-negative aggregated values. A zero-total column remains zero. The tooltip shows original values alongside percentages, and the data details keep the original file values. Manual Y limits and Sync across charts do not apply to this layout.
In Grouped and Stacked layouts, Format values as percentages only adds a percent sign to existing values. It does not normalize the data. Use 100% Stacked to calculate shares.
Stacked Area
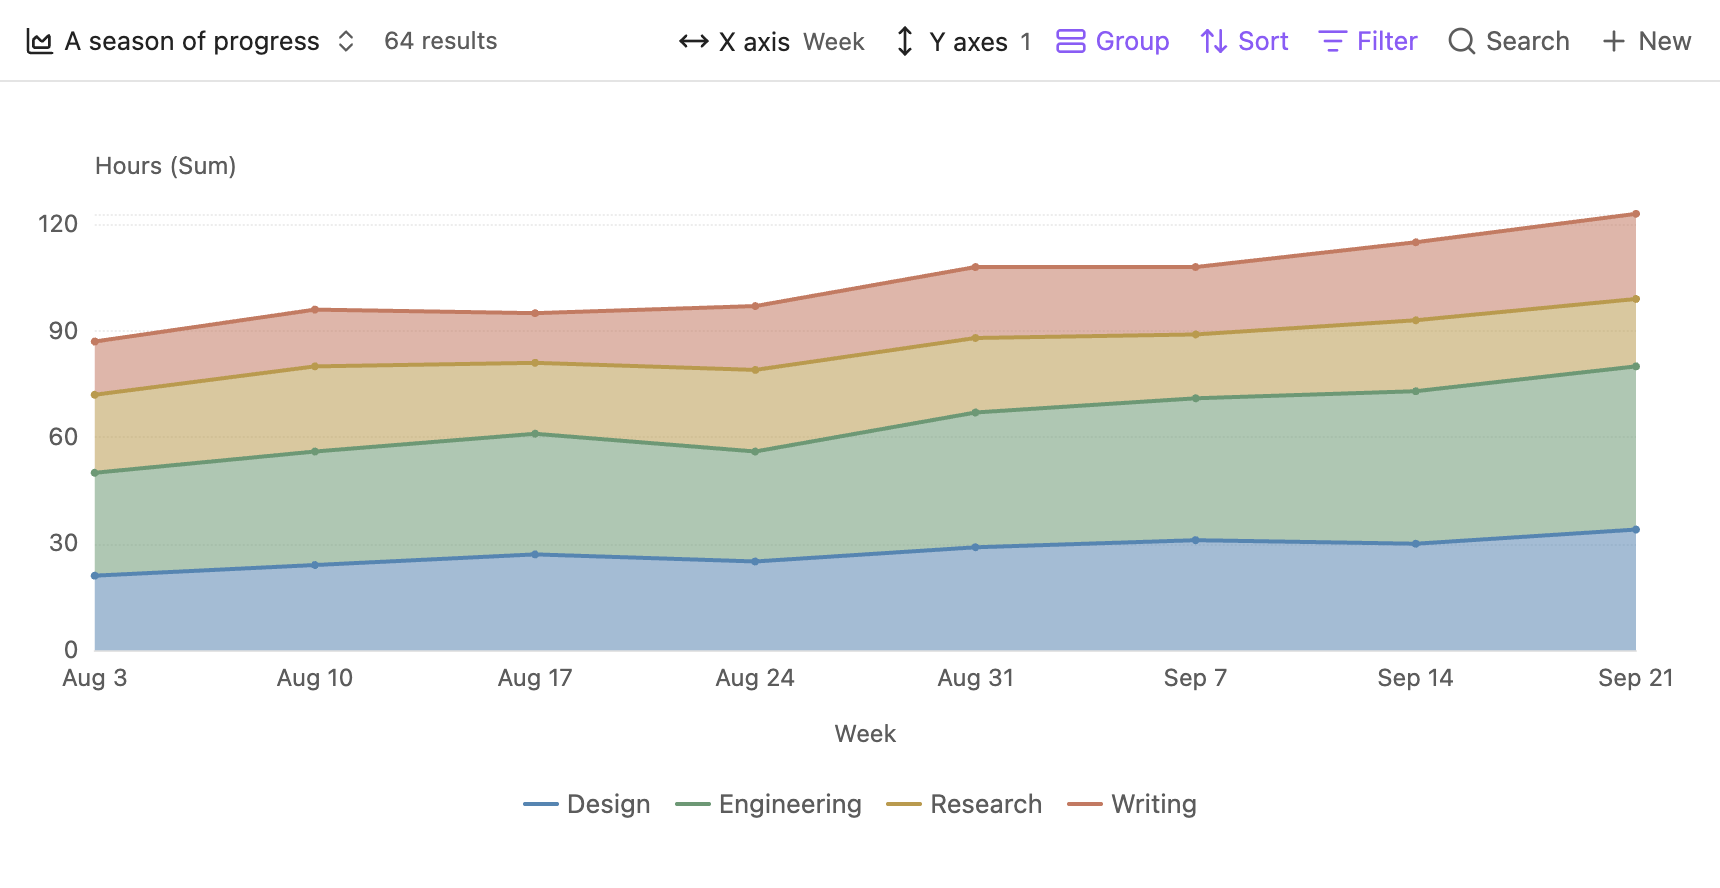
Groups stack into a cumulative total at each X position.
Missing group values at an existing X position are filled with zero. With Show missing dates enabled, a whole period without values remains a gap. Positive and negative values stack separately. Scale synchronization uses stacked totals.
Pie
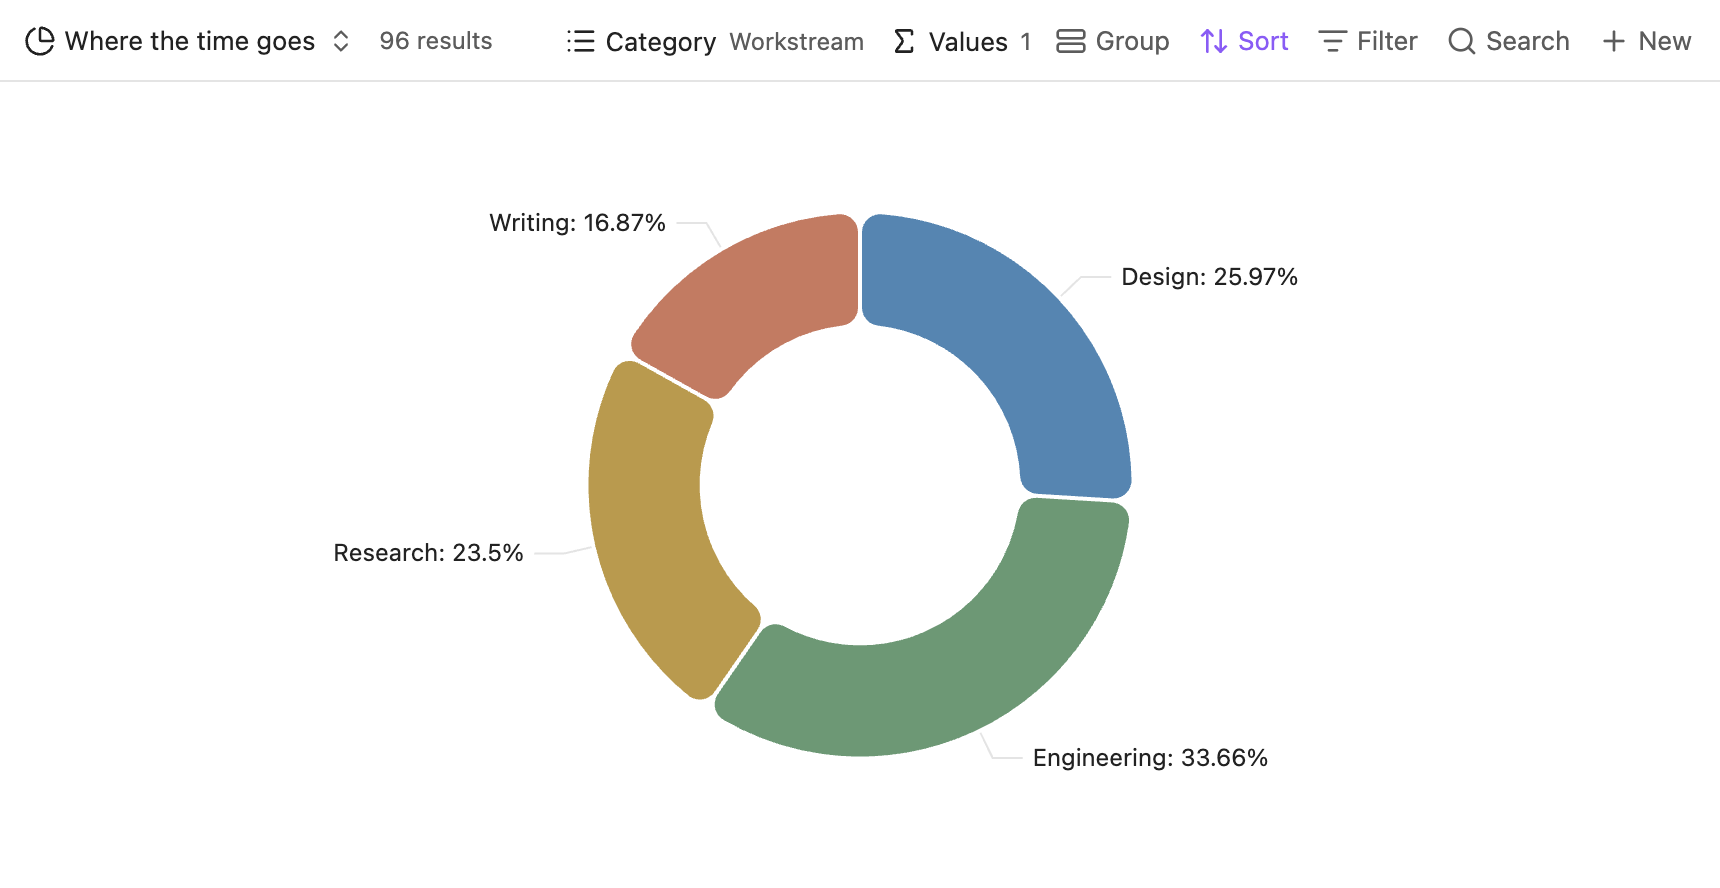
The Pie view uses a centered donut chart. Choose a Category and one or more Values. Each value property produces its own chart.
Show labels, Show as percentages, and Ignore null control the presentation. Percentage labels show each slice's share of the pie. When native grouping is enabled, slice labels include both the group and the category.
Radar
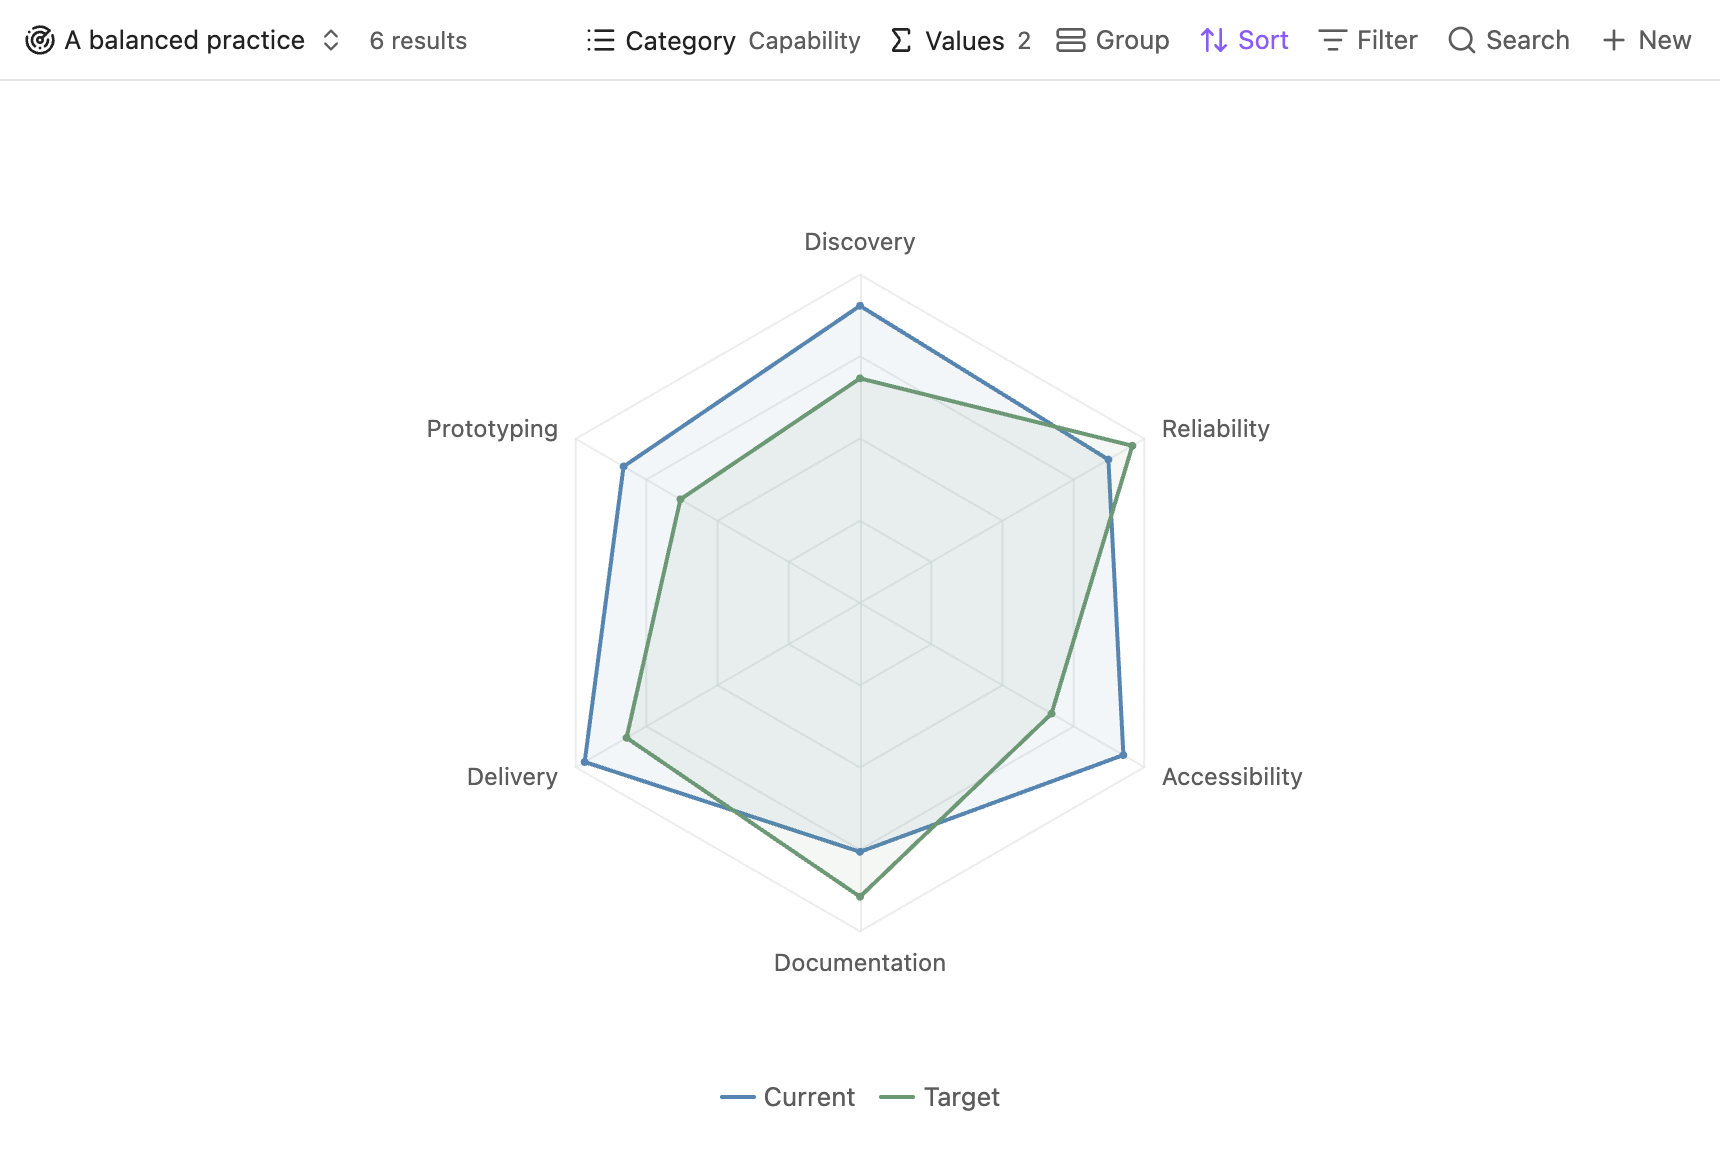
Radar overlays selected value properties in a single chart. Categories form the spokes; each value property forms a profile. Native groups can add further profiles.
A radar needs at least three categories with values.
- Shared across categories uses a common scale, preserving differences in magnitude.
- Per category gives each category its own scale, useful for comparing profile shapes when category ranges differ.
- Fill areas toggles the translucent profile fills.
A missing value is drawn at zero and shown as missing in its tooltip. Click a profile to inspect its source files and categories.
Scatter
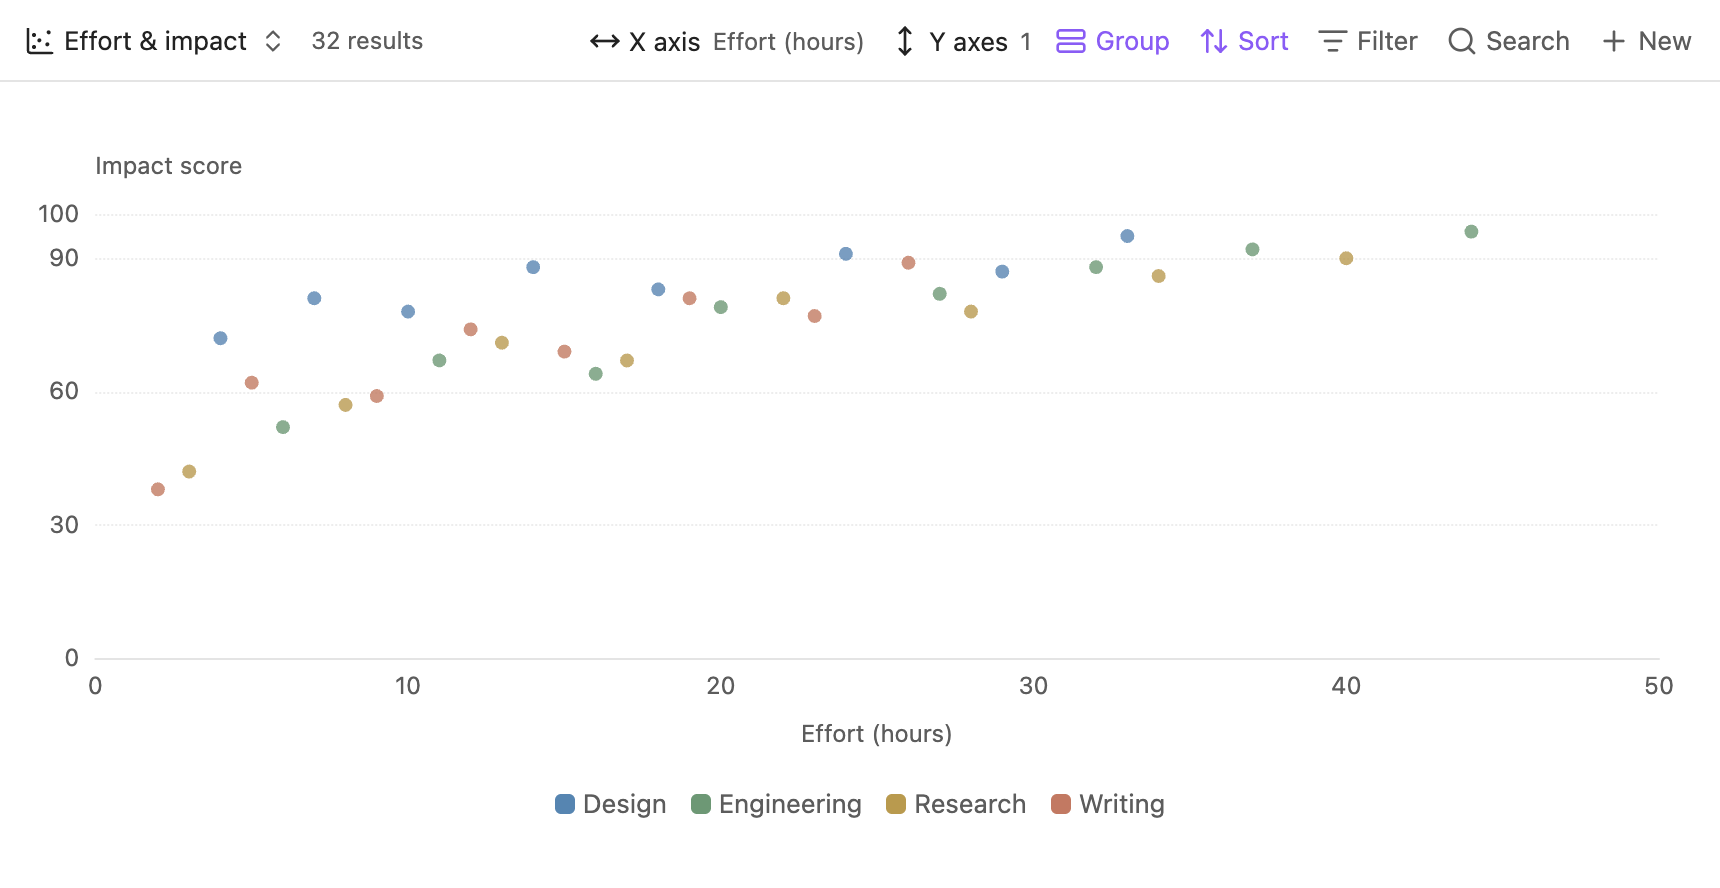
Scatter preserves individual observations by default using None aggregation. You can instead aggregate points with the same X position and group using the Y menu.
When a column contains one selectable point, hover or click anywhere along that column. If several points share a column, select a specific point to inspect the correct files.
Multiple Y properties
Line, Bar, Stacked Area, Pie, and Scatter render one chart per selected Y property. The layout adapts to the pane width and scrolls vertically when needed. Radar places selected properties together in one profile comparison.
For chart types outside these six built-in views, see AI Chart.