
Groups and aggregation
X determines the positions or categories. Y determines the measures. Group splits those measures into separate series.
For example, with X set to Week, Y set to Hours, and Group set to Activity, each week contains a separate series for each activity.
Native Bases groups
Use the Group menu in the toolbar. The charts use the groups selected by Bases and preserve their manual order. Filtering groups changes the data shown in the chart.
- Line and Scatter use one color per group.
- Bar supports Grouped, Stacked, and 100% Stacked layouts.
- Stacked Area stacks group contributions.
- Pie includes group and category in slice labels.
- Radar creates a profile for each selected measure and group.
Use Group colors to assign a preset or custom color to individual groups in this view.
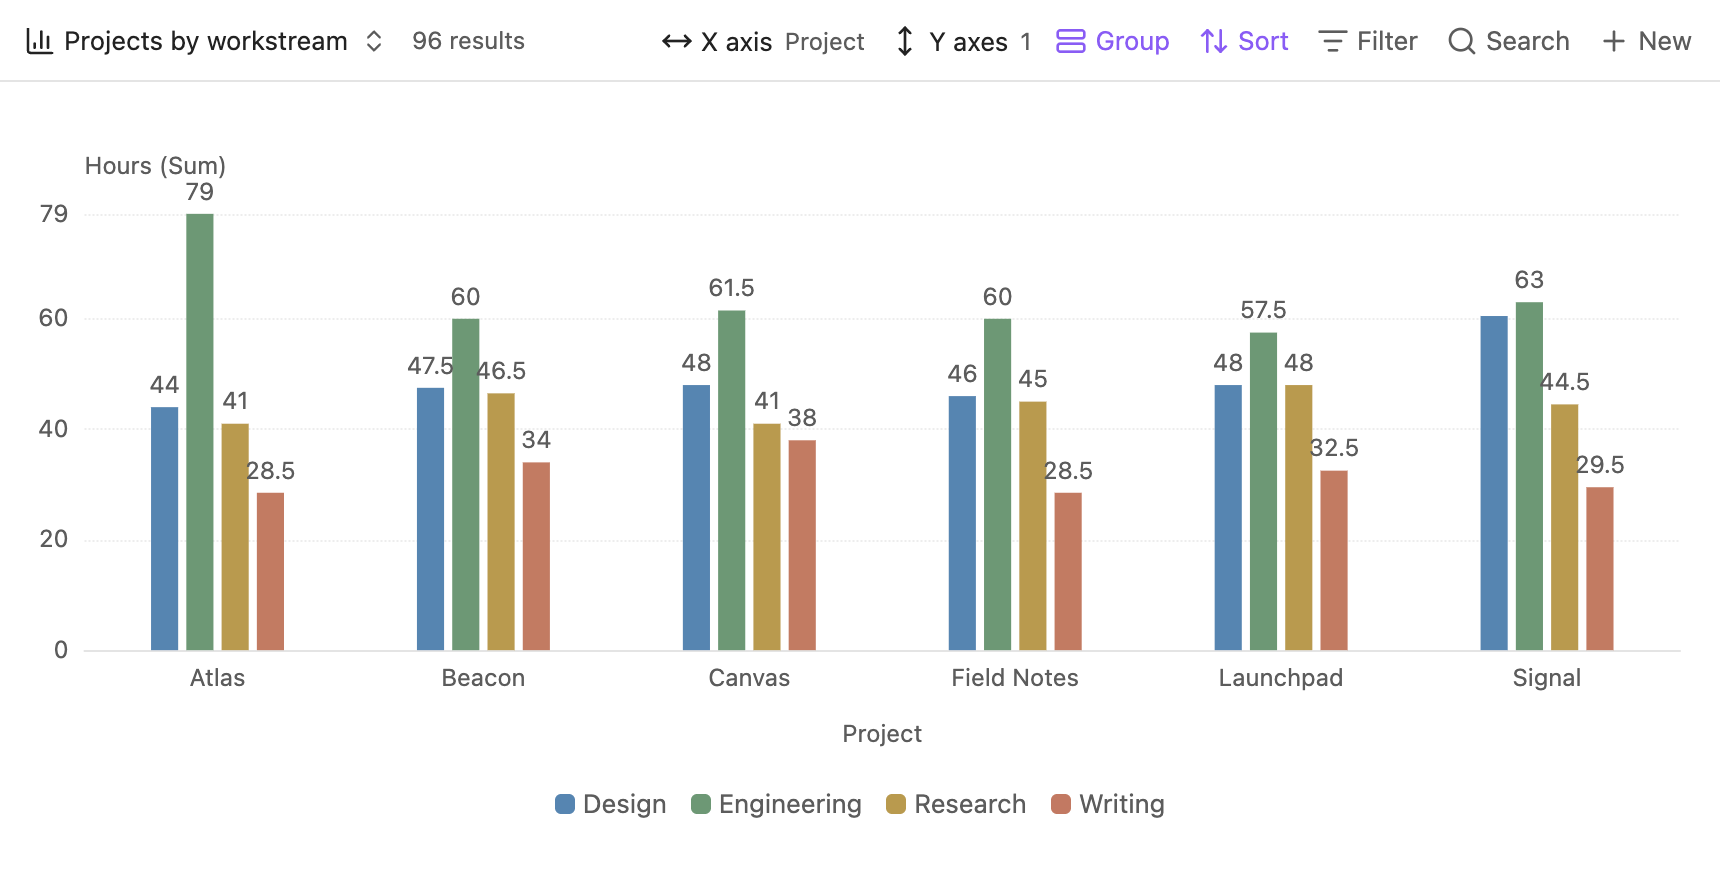
Choose an aggregation for each measure
Open Y axes (or Values) and use the aggregation control beside each selected property.
Aggregation happens within each X value, Y property, and group. With calendar grouping, timestamps first become day, week, month, or year buckets.
Show missing dates adds empty calendar positions without adding records to an aggregation. Missing values remain distinct from recorded zeros.
Stack group contributions
In a Bar view, open the native view settings and set Bar layout to Stacked or 100% Stacked. The setting belongs to that view and applies independently to each selected Y property.
For example, with X = day, Y = hours (Sum), and Group = subject:
Stacked bars have heights of 6 and 7. In 100% Stacked, Monday's segments are 33.3%, 50%, and 16.7%; Tuesday's percentages use its own total of 7. Missing group contributions are zero; they do not create source files in the data details.
Stacks add the aggregated group values. With Sum or Count and non-overlapping groups, this matches the ungrouped total. With Average, Min, or Max, the sum is not the overall aggregate. The tooltip labels it Sum of groups. In 100% Stacked, percentages are shares of that sum, not shares of the original records.
Ordinary Stacked supports negative values on the opposite side of zero. 100% Stacked requires non-negative group values. All-zero columns stay at zero rather than dividing by zero. Click a column to inspect all its source records, including their group and original value.
Count notes or count a property
To count the notes in each category, use file name → Count. Every note has a file name.
To count how many records have a particular property value, select that property and use Count. Missing values are excluded. A numeric zero is a value and is counted.
Multiple measures
A view can show Hours → Sum and Rating → Average together, with a separate chart for each measure. Their aggregations are independent. Radar compares the selected measures in a single chart instead.
The example below sums hours and deliverables by week and workstream. Both charts use the same group colors, with a separate scale for each measure.
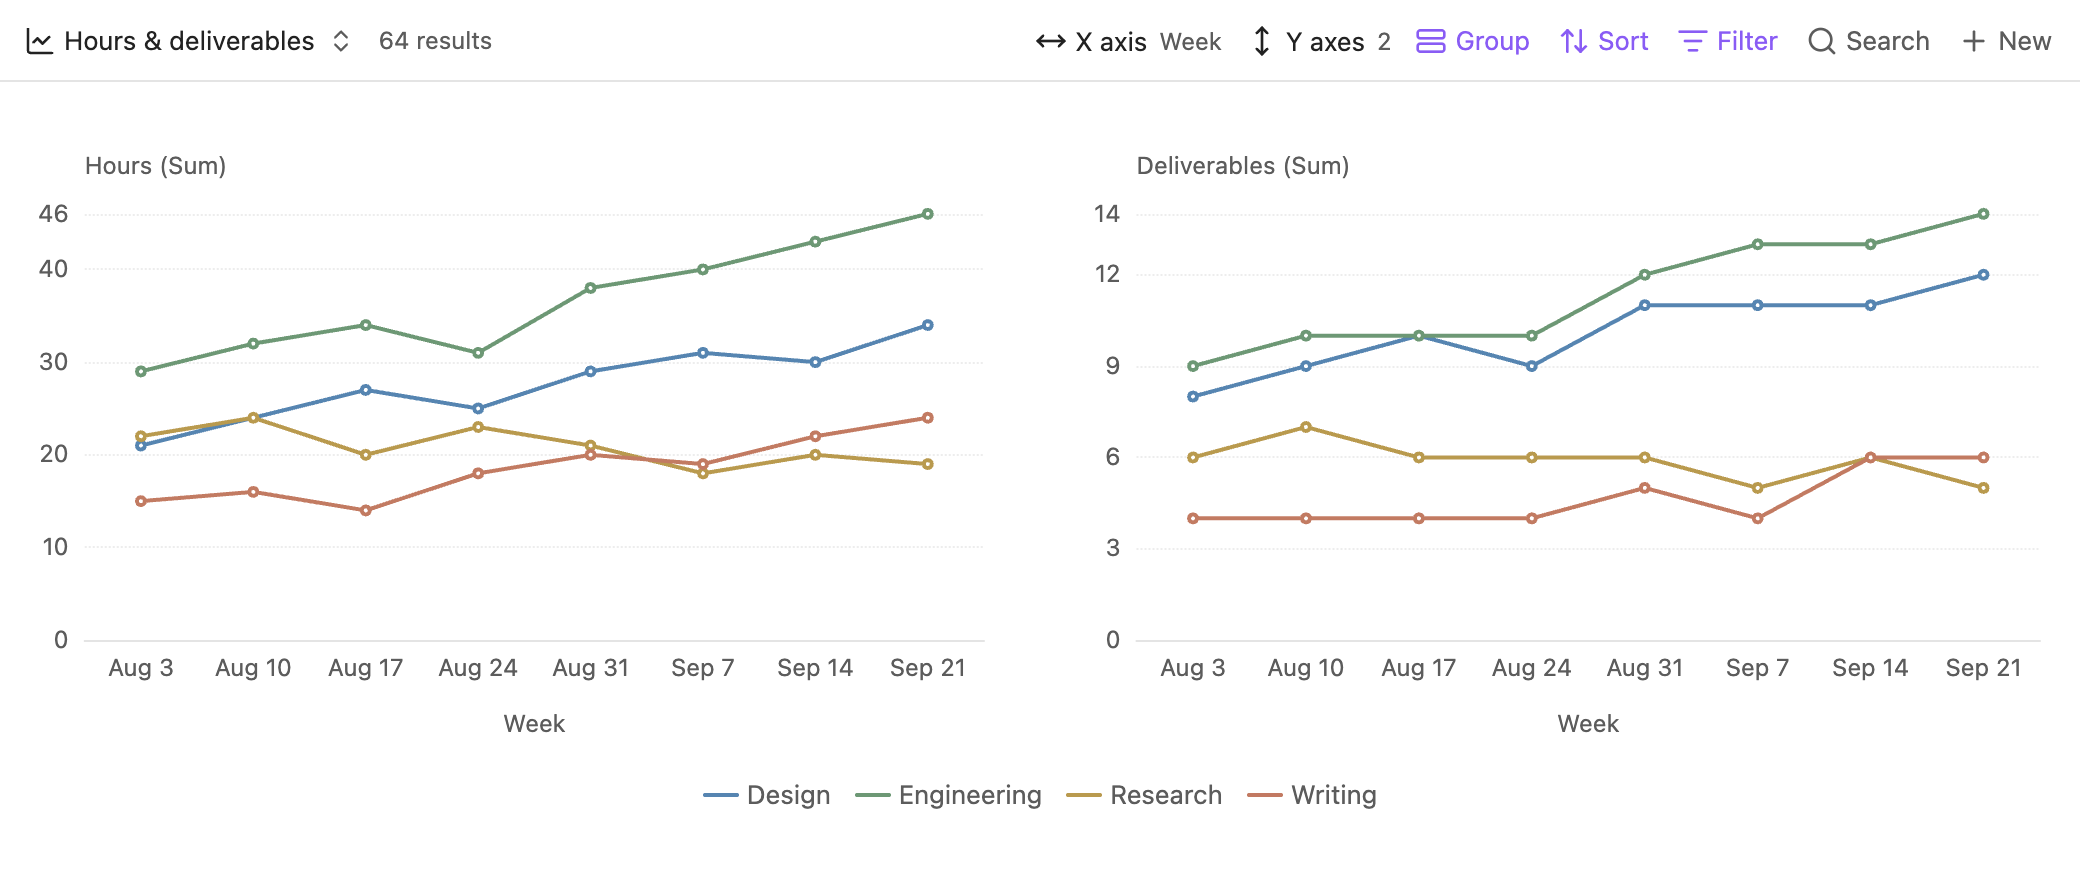
Use Y scale controls when several charts should share the same scale.
Inspect an aggregate
Click a bar, point, area column, pie slice, or radar profile to see its source files and their individual values.