UI gallery
Chart views, configuration controls, and a Claudian example. Select an image to enlarge it. See the mobile UI gallery for phone layouts.
Multiple measures
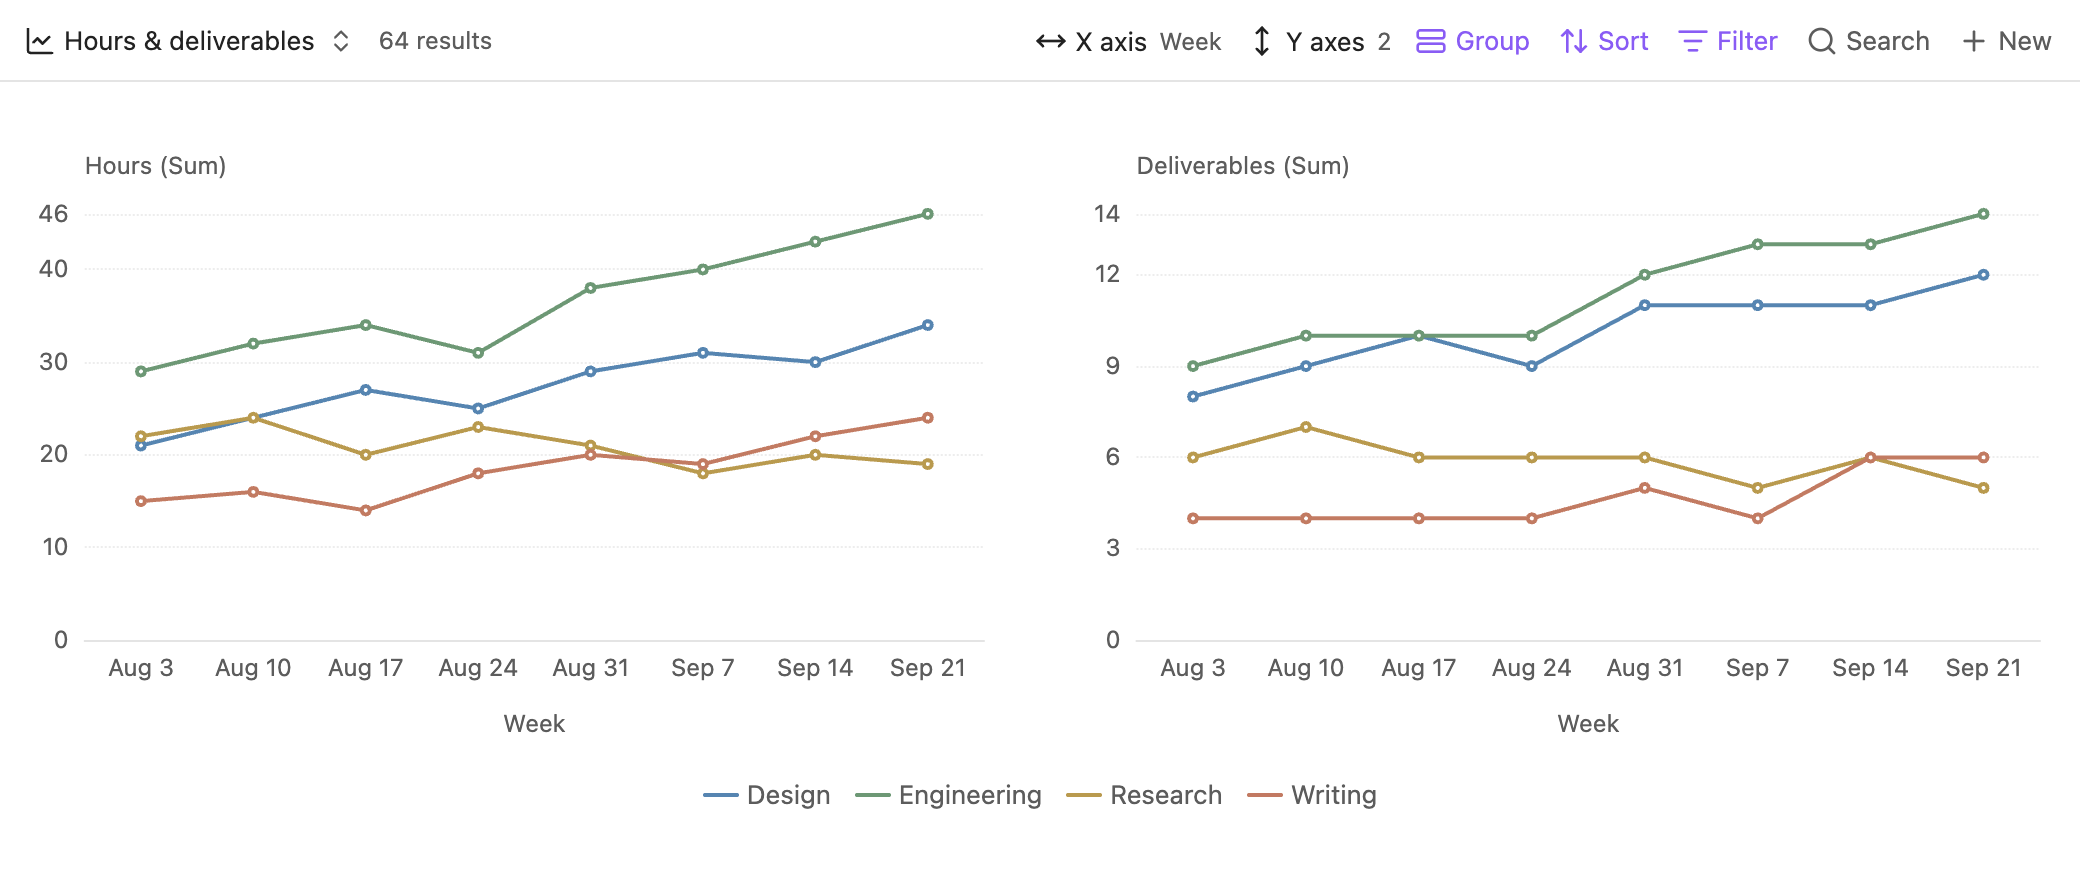
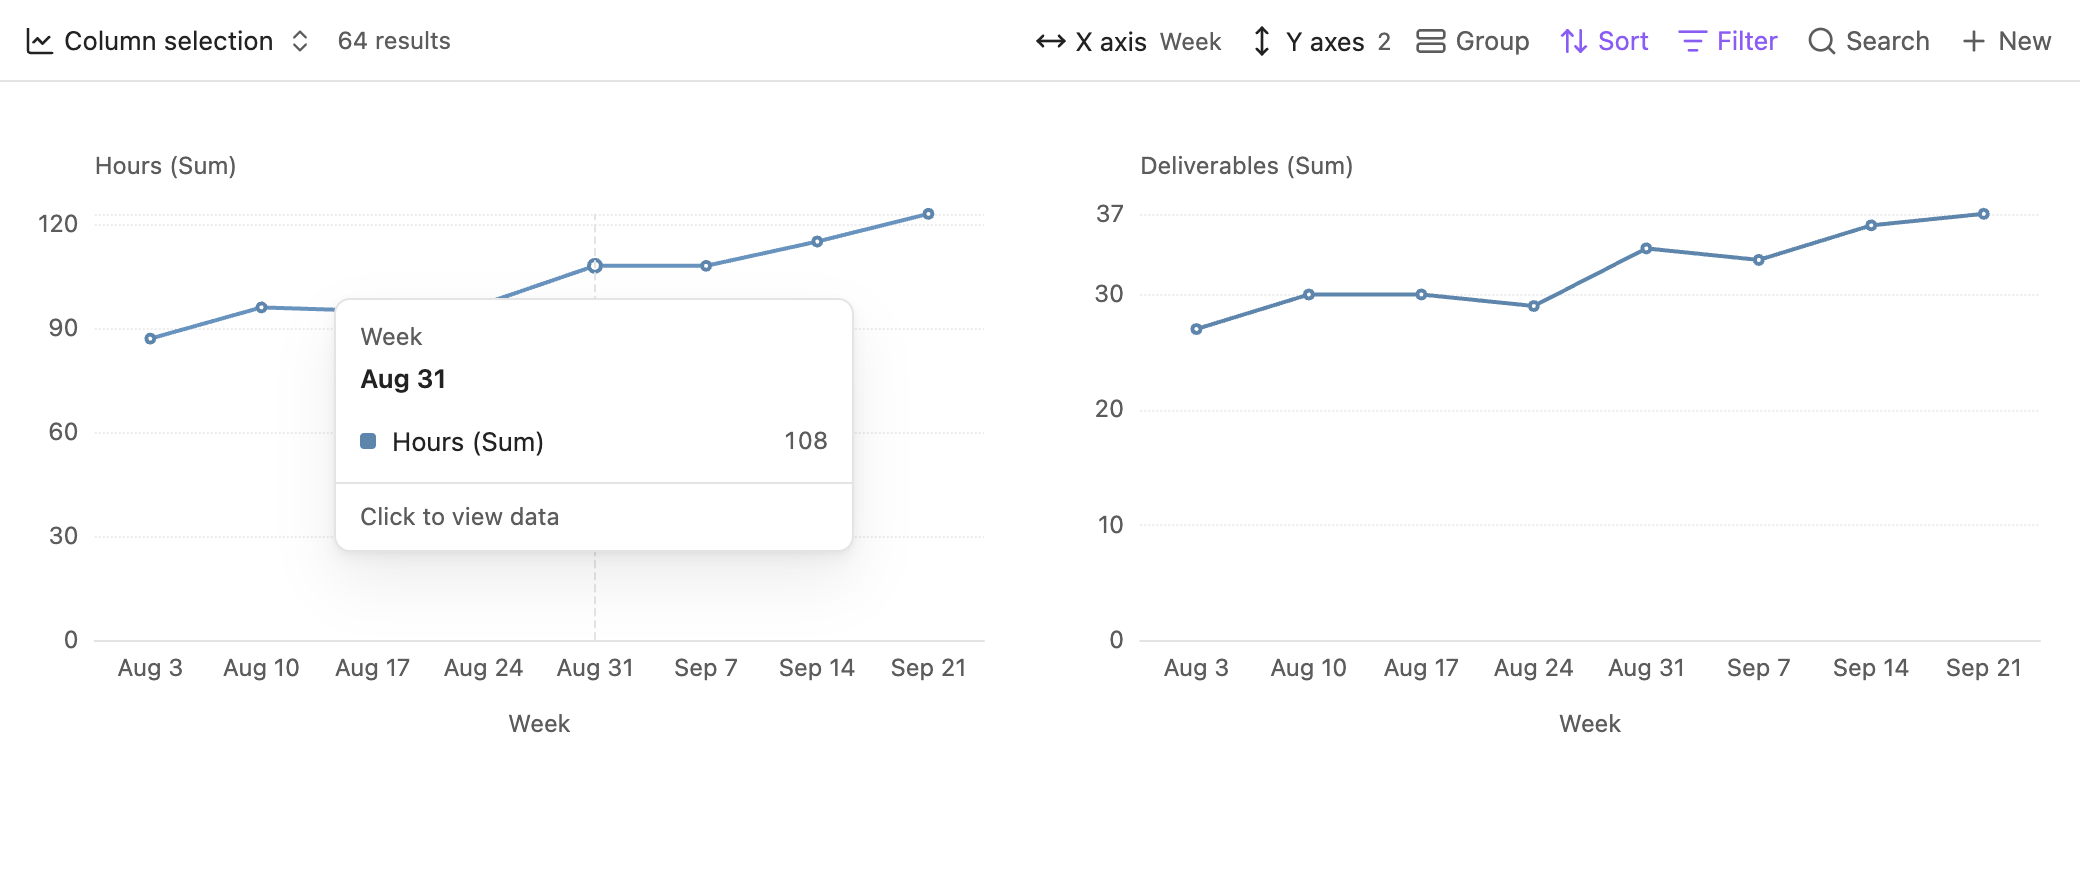
Each Y property has its own chart, scale, and aggregation. This view compares weekly hours and deliverables across four workstreams, with the same colors in both charts.
Date grouping
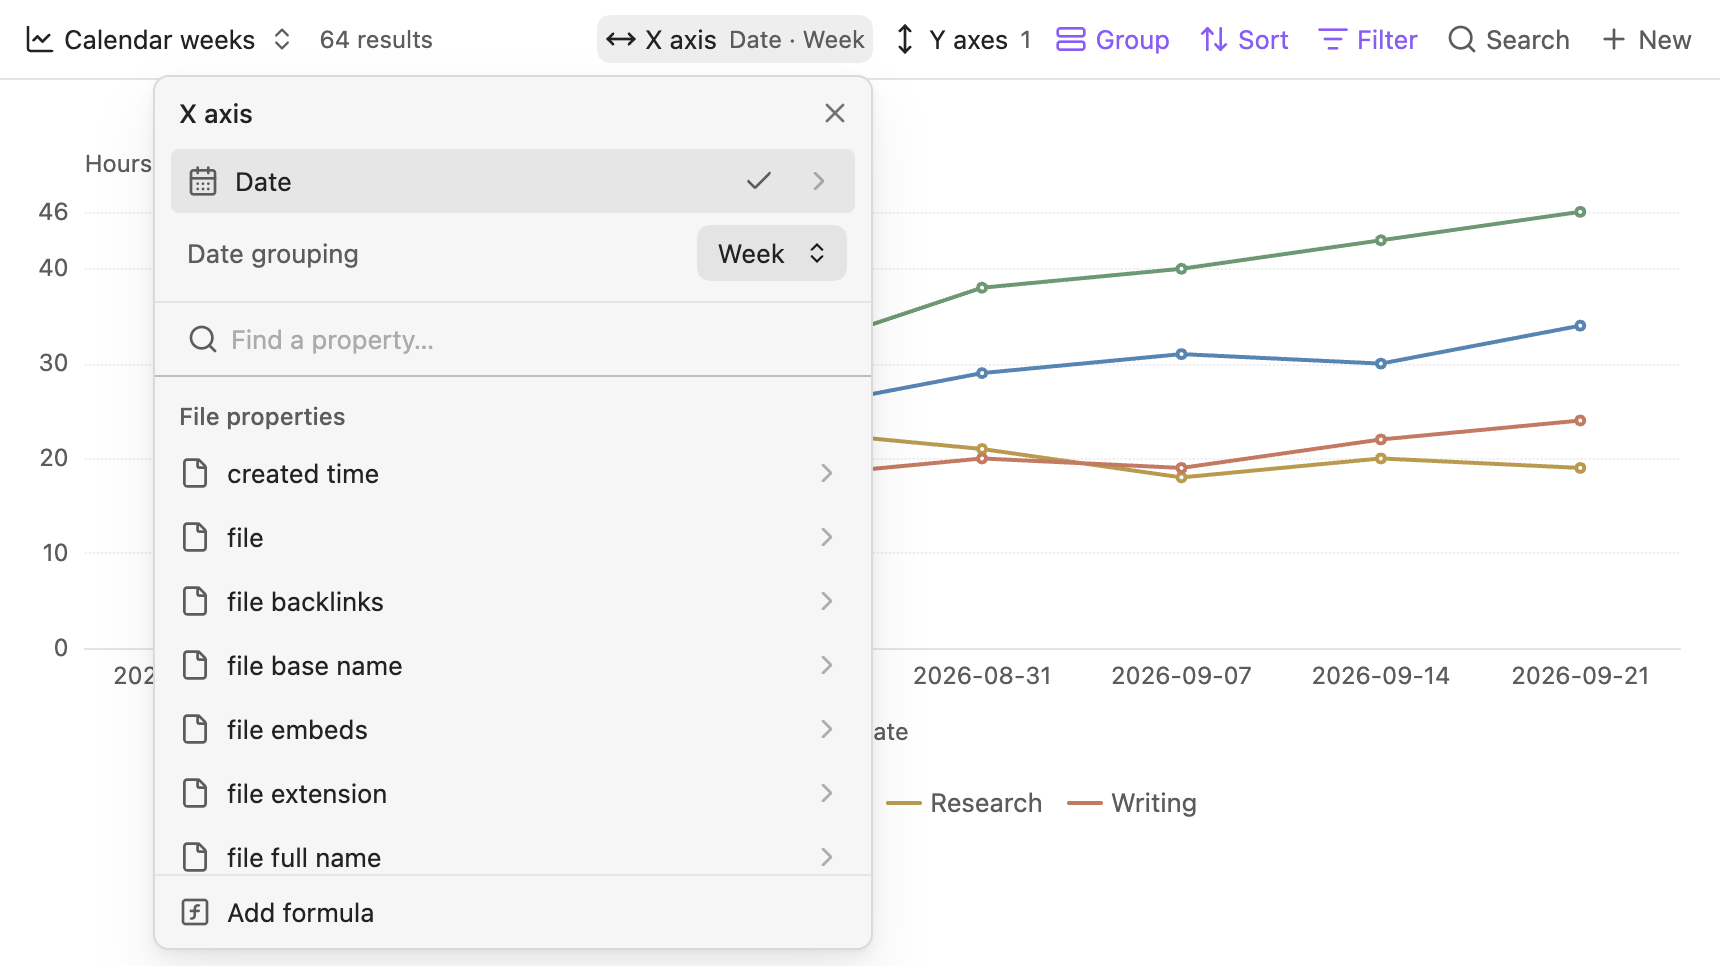
The X-axis picker groups the Date property by calendar week. Day, month, and year grouping are also available.
Formula editor
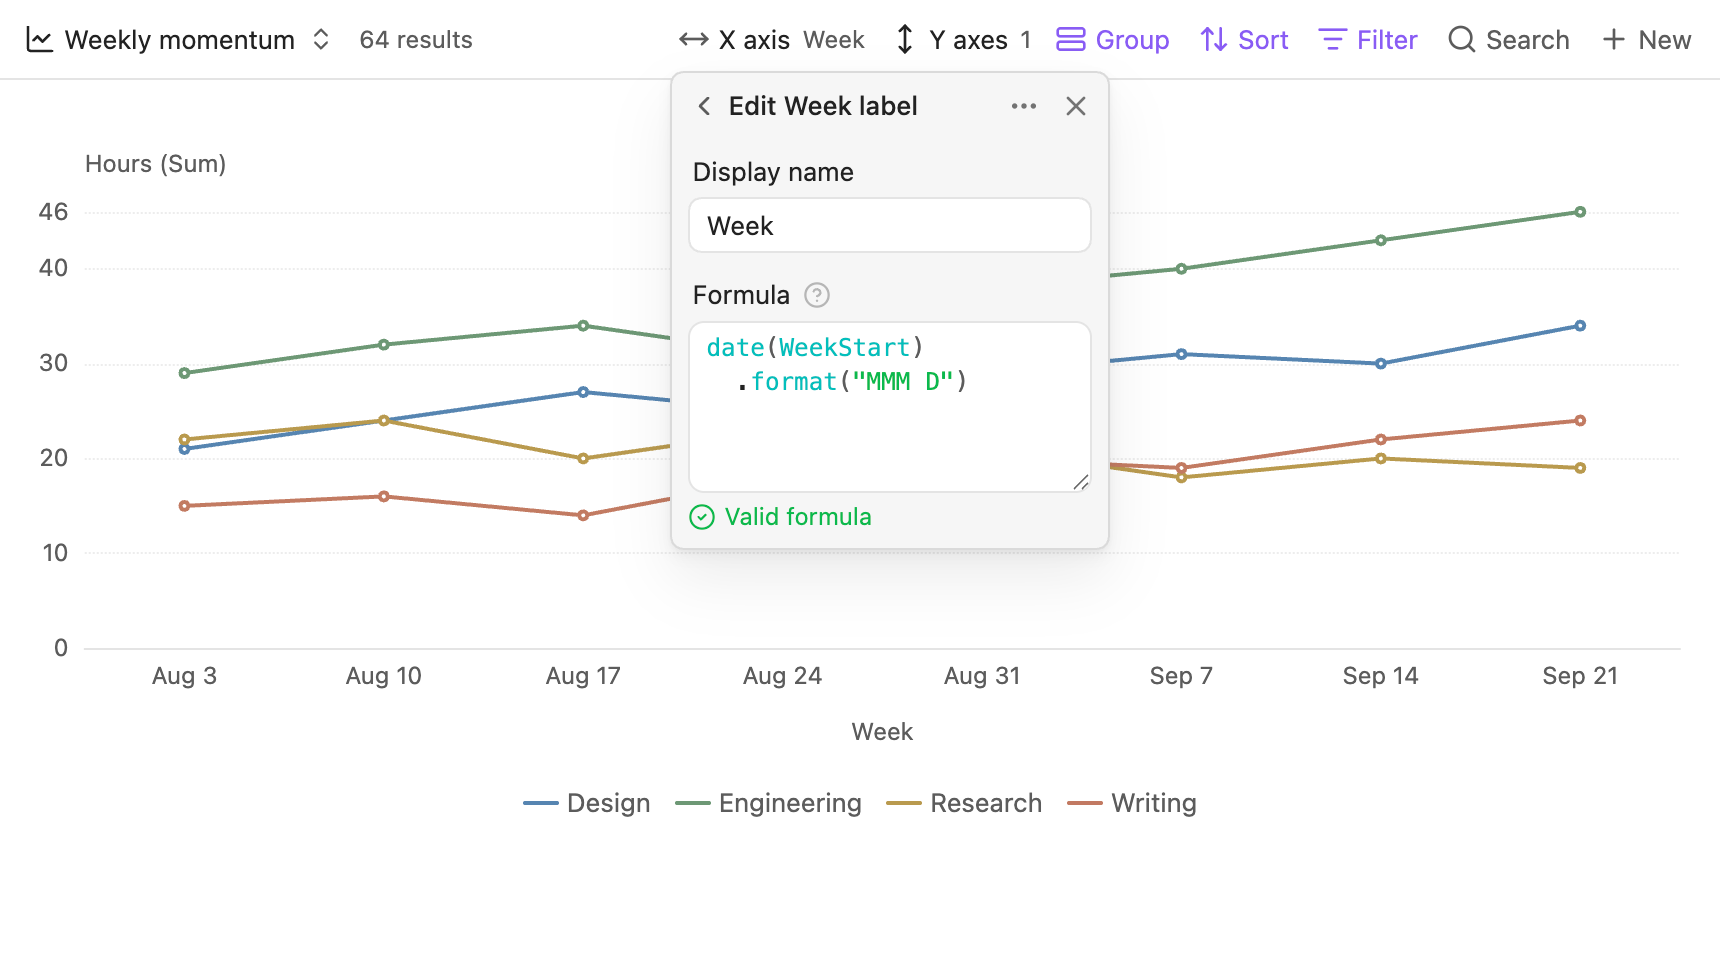
The Week label formula formats an existing week-start date. The X-axis picker opens Obsidian’s native formula editor.
Column interaction
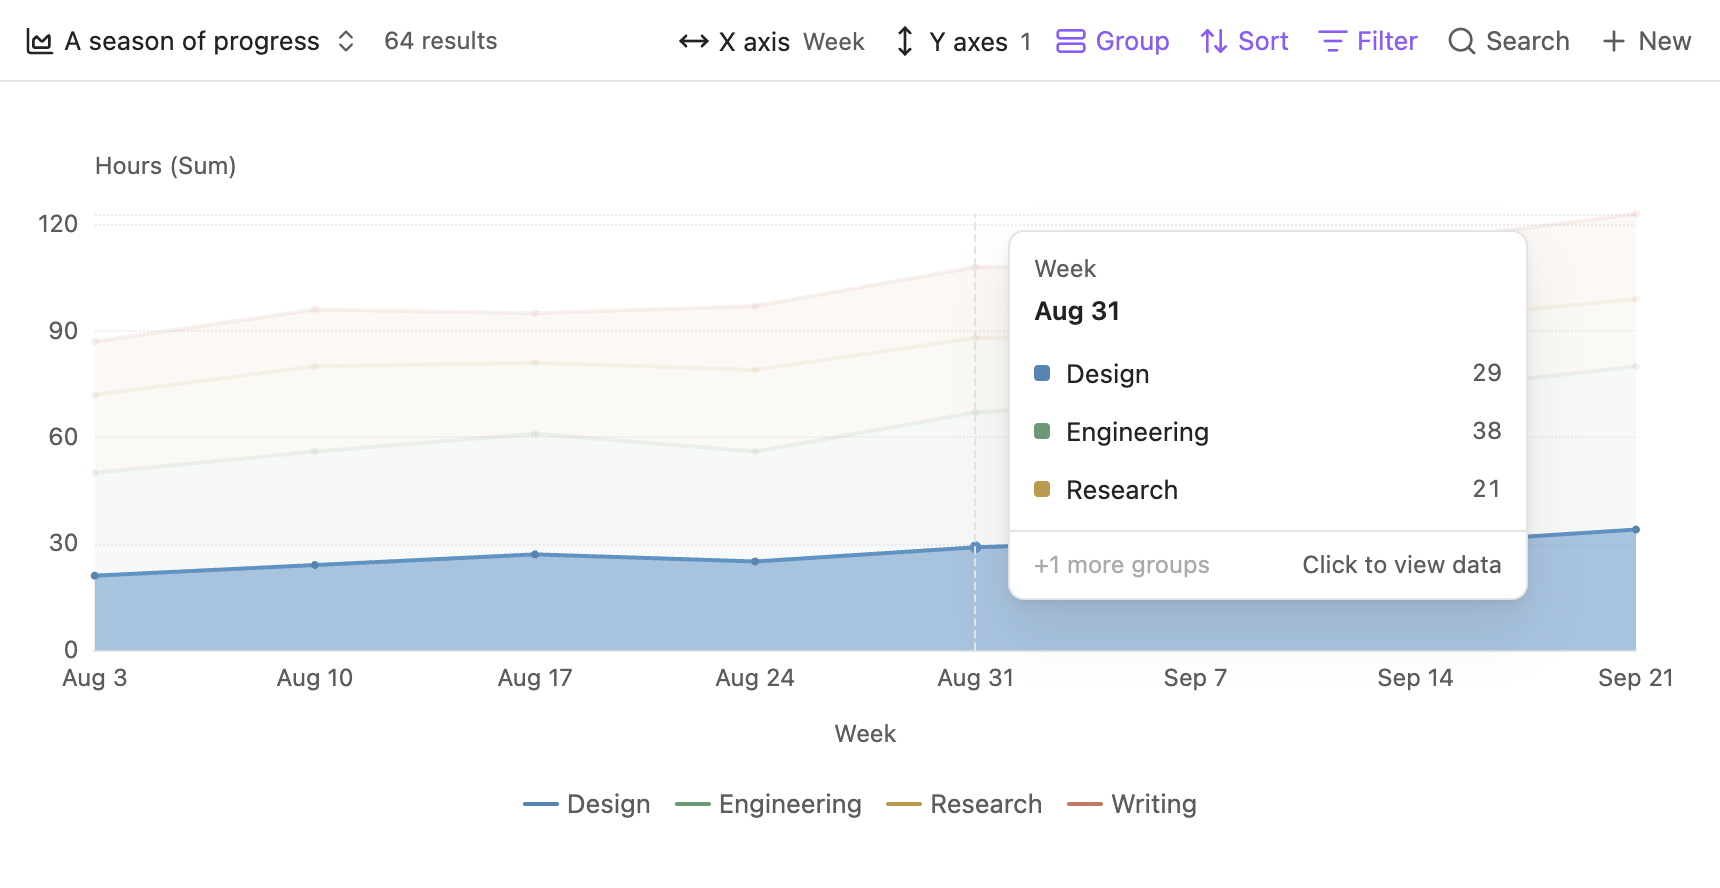
A column containing one selectable point supports hover and click across the plot height.
Data details
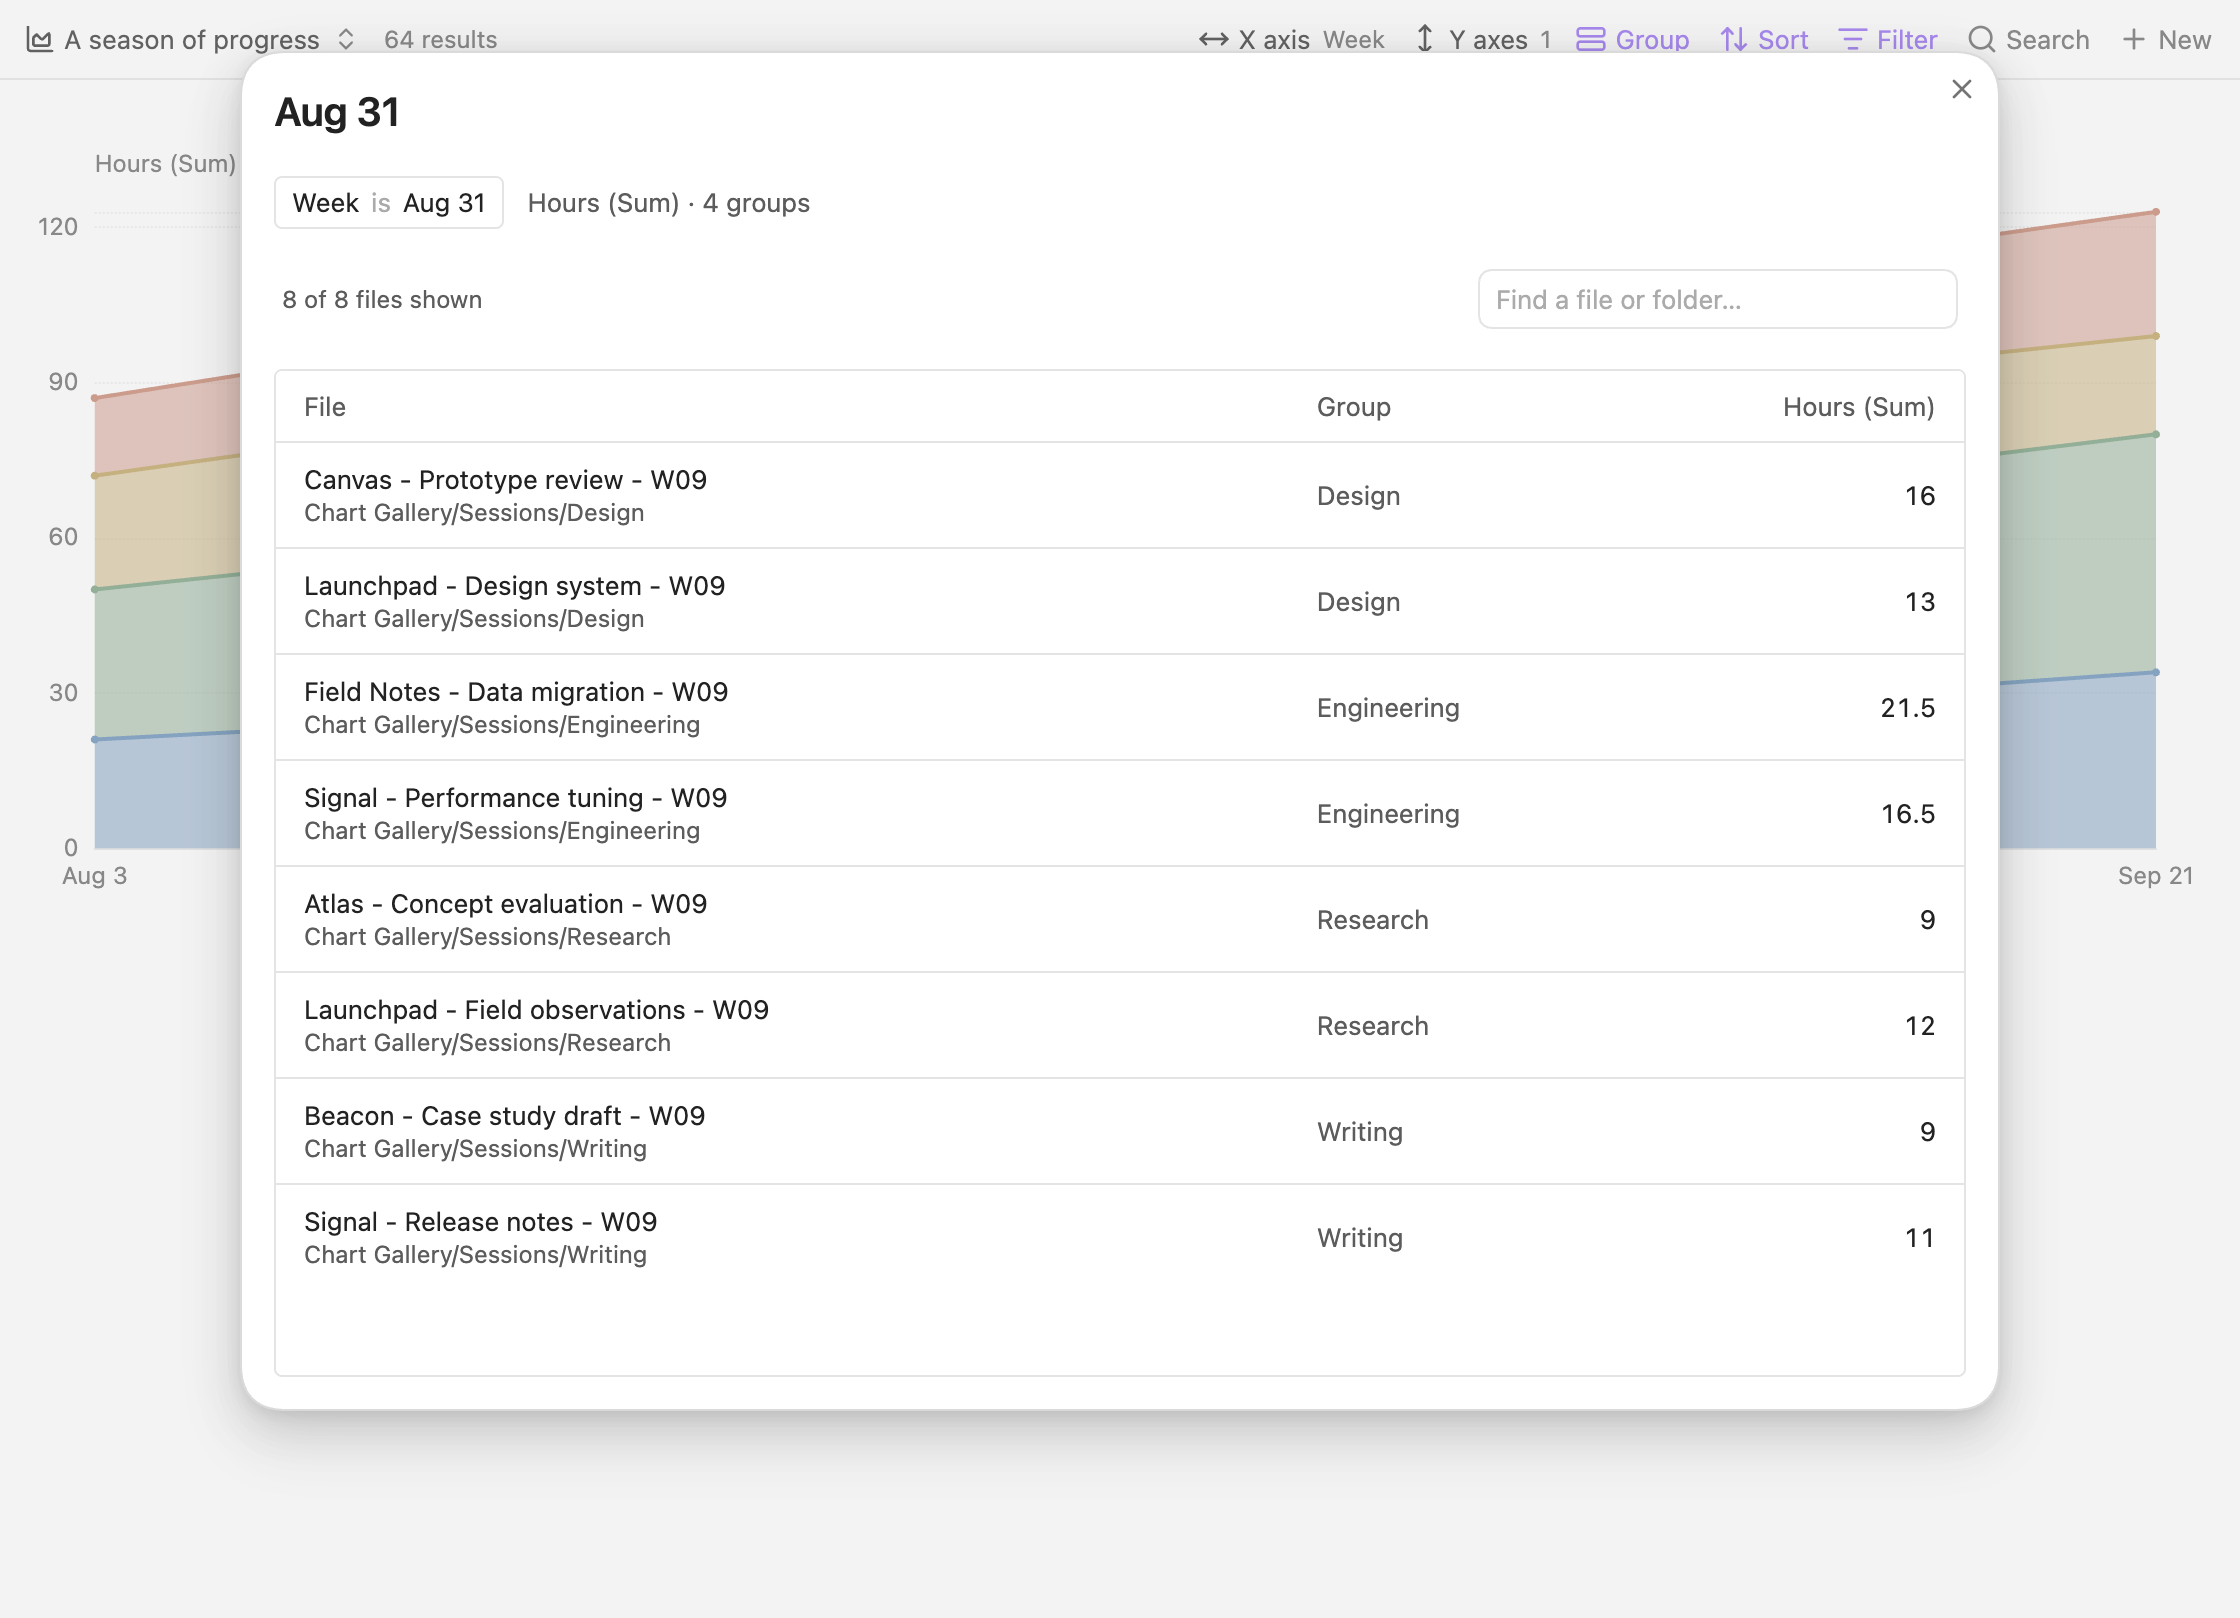
Click a chart value to open its source-file table. Search by file name or folder and select a row to open the note.
Color palettes
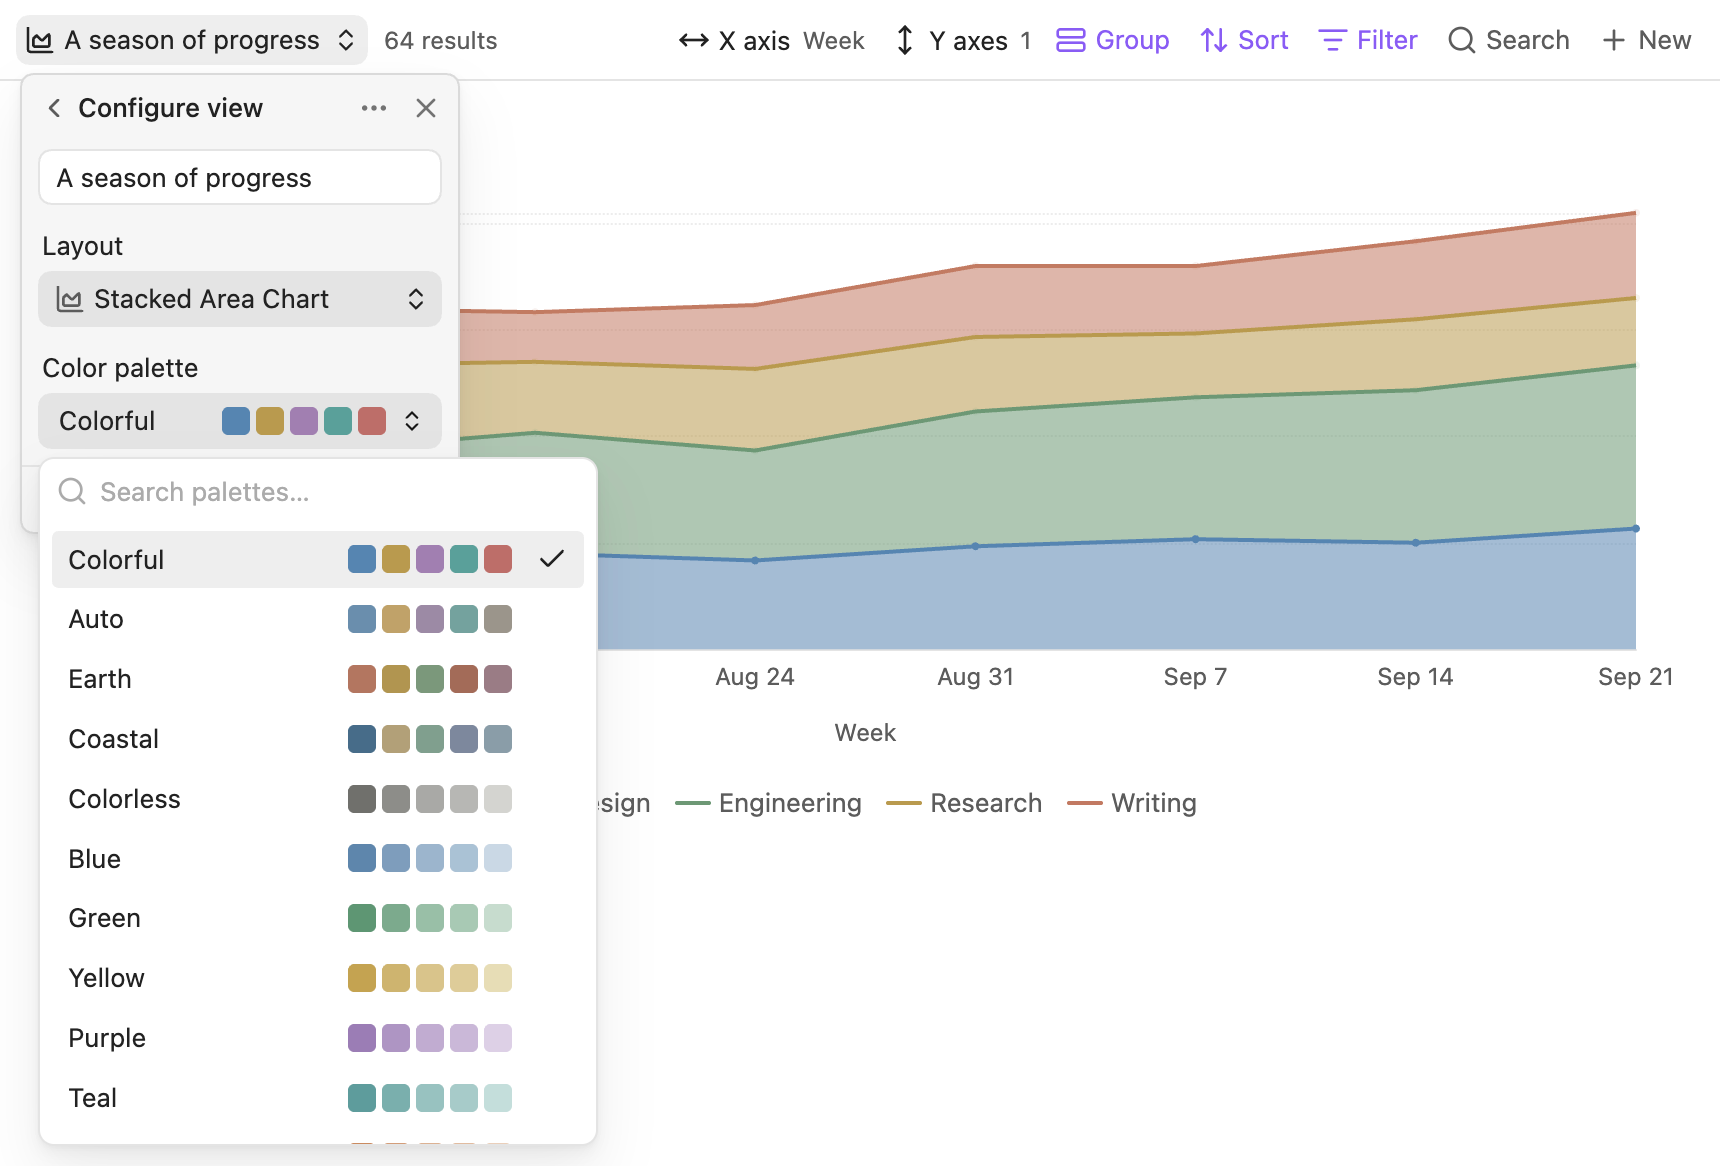
Each view stores its own palette. The picker includes color previews and search.
Line
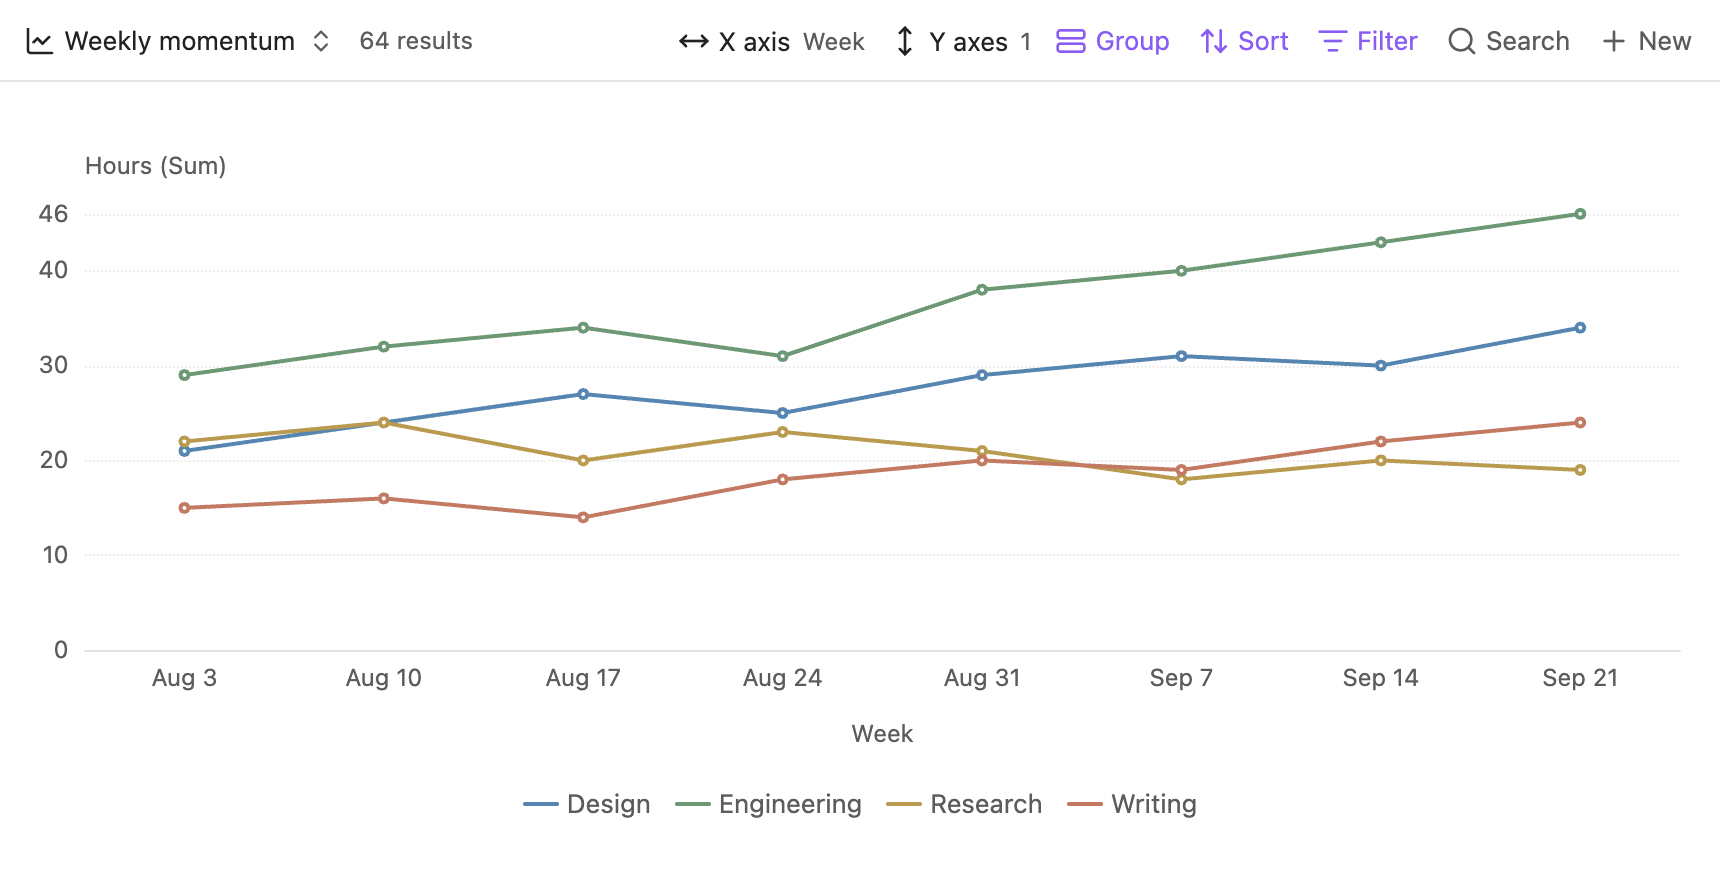
Weekly hours are grouped by Design, Engineering, Research, and Writing.
Bar
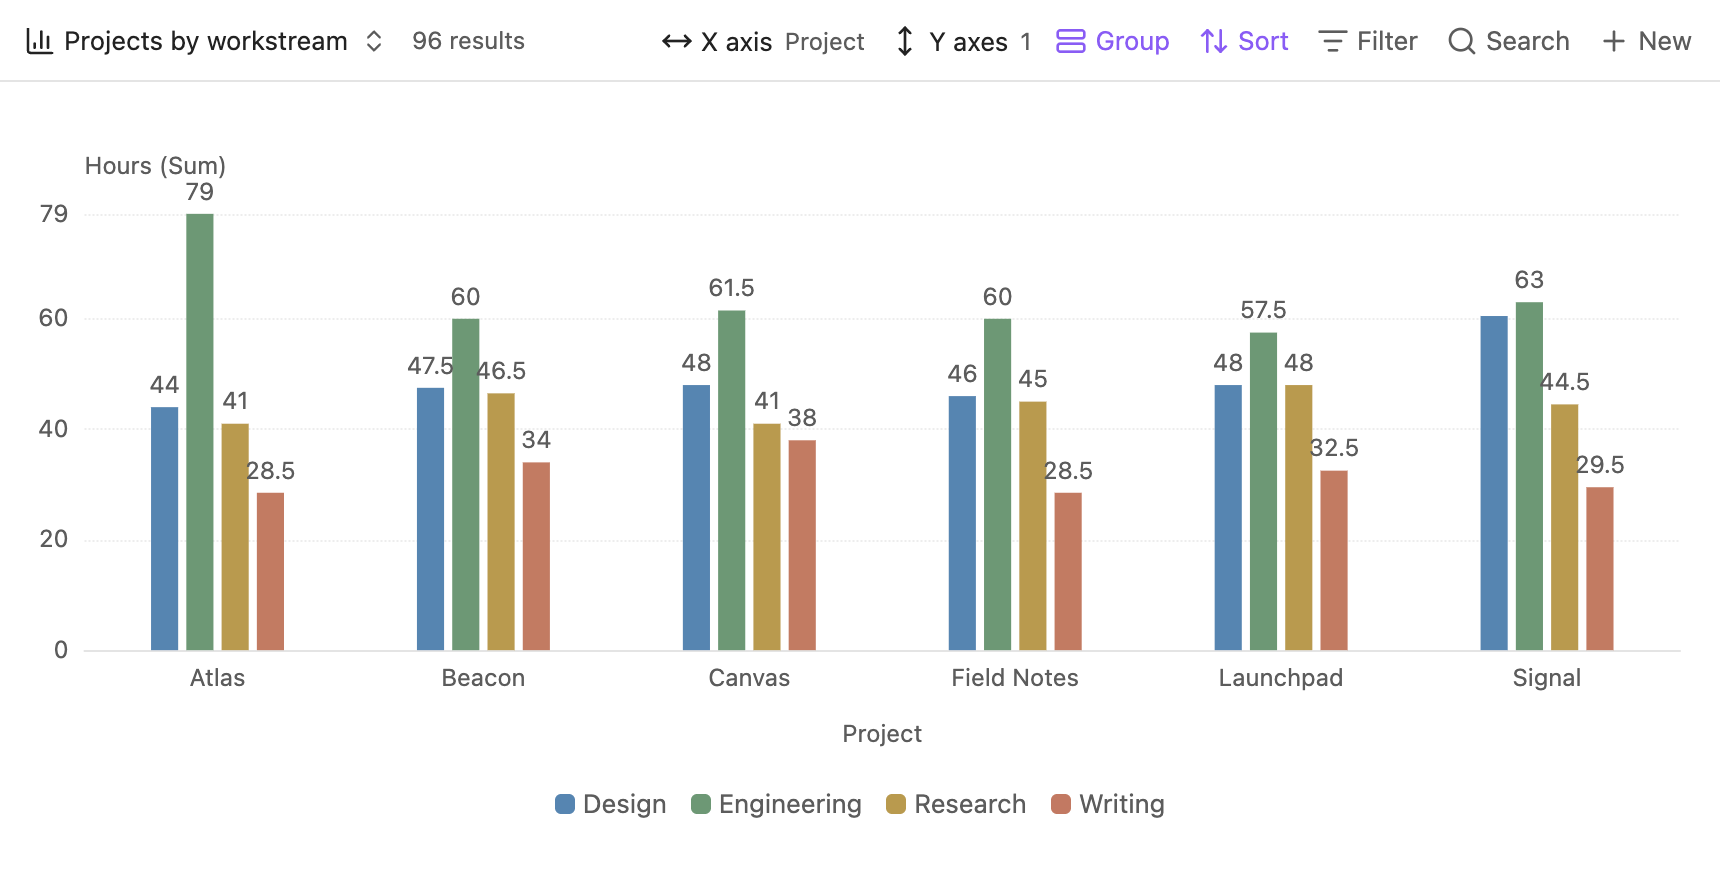
Native Bases groups produce a separate bar for each workstream within a project.
Stacked Area
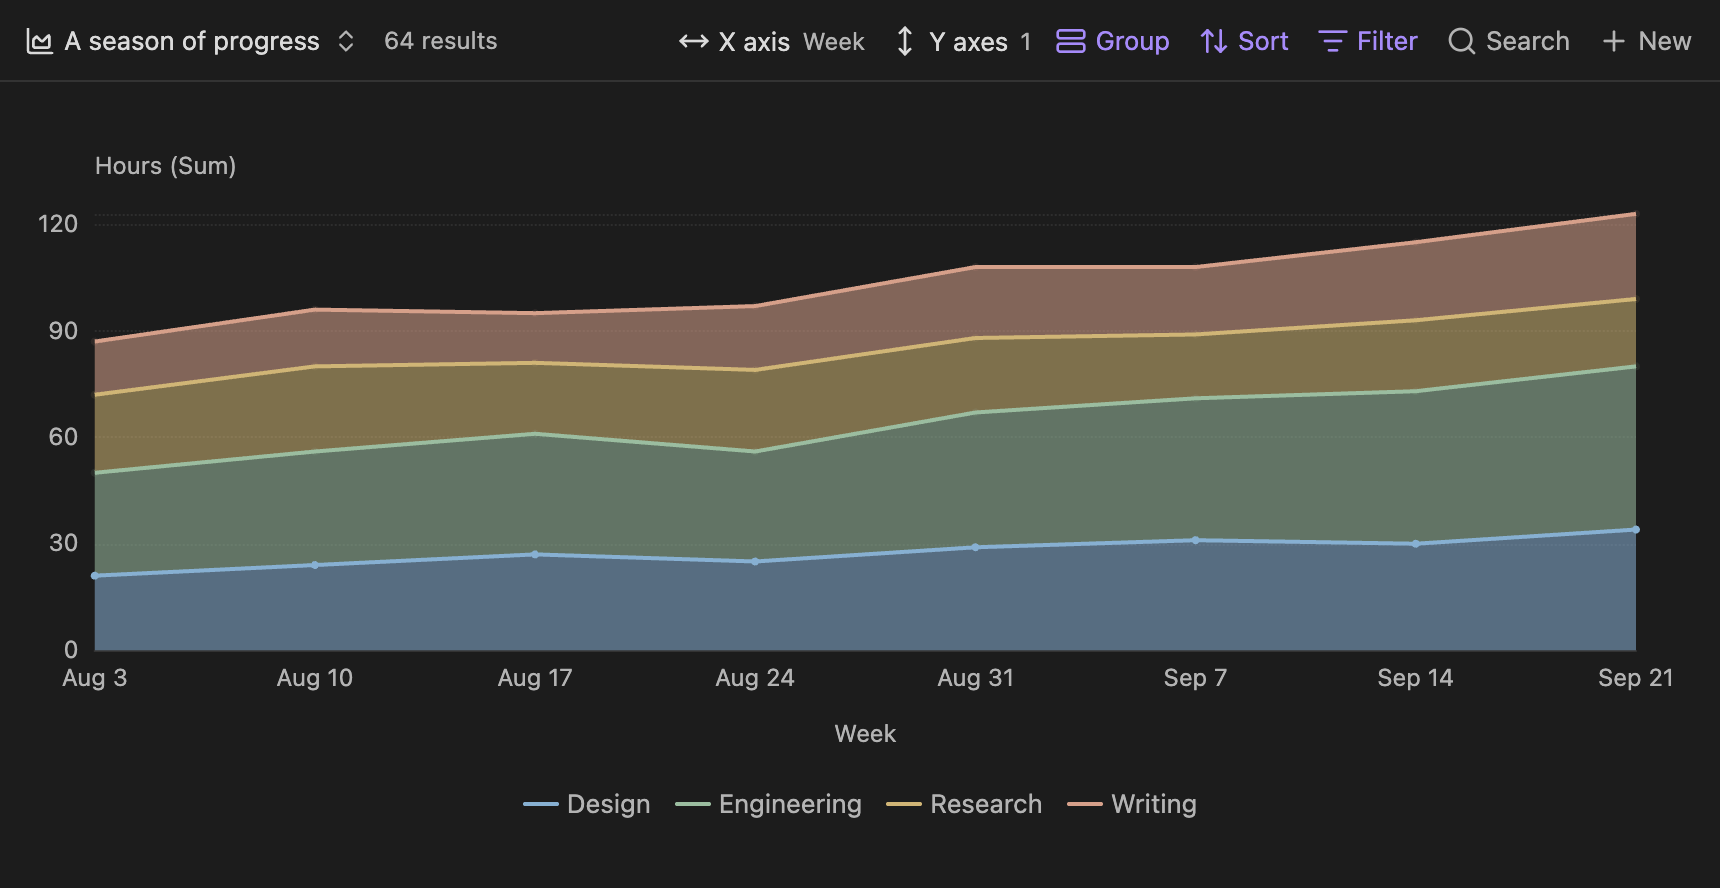
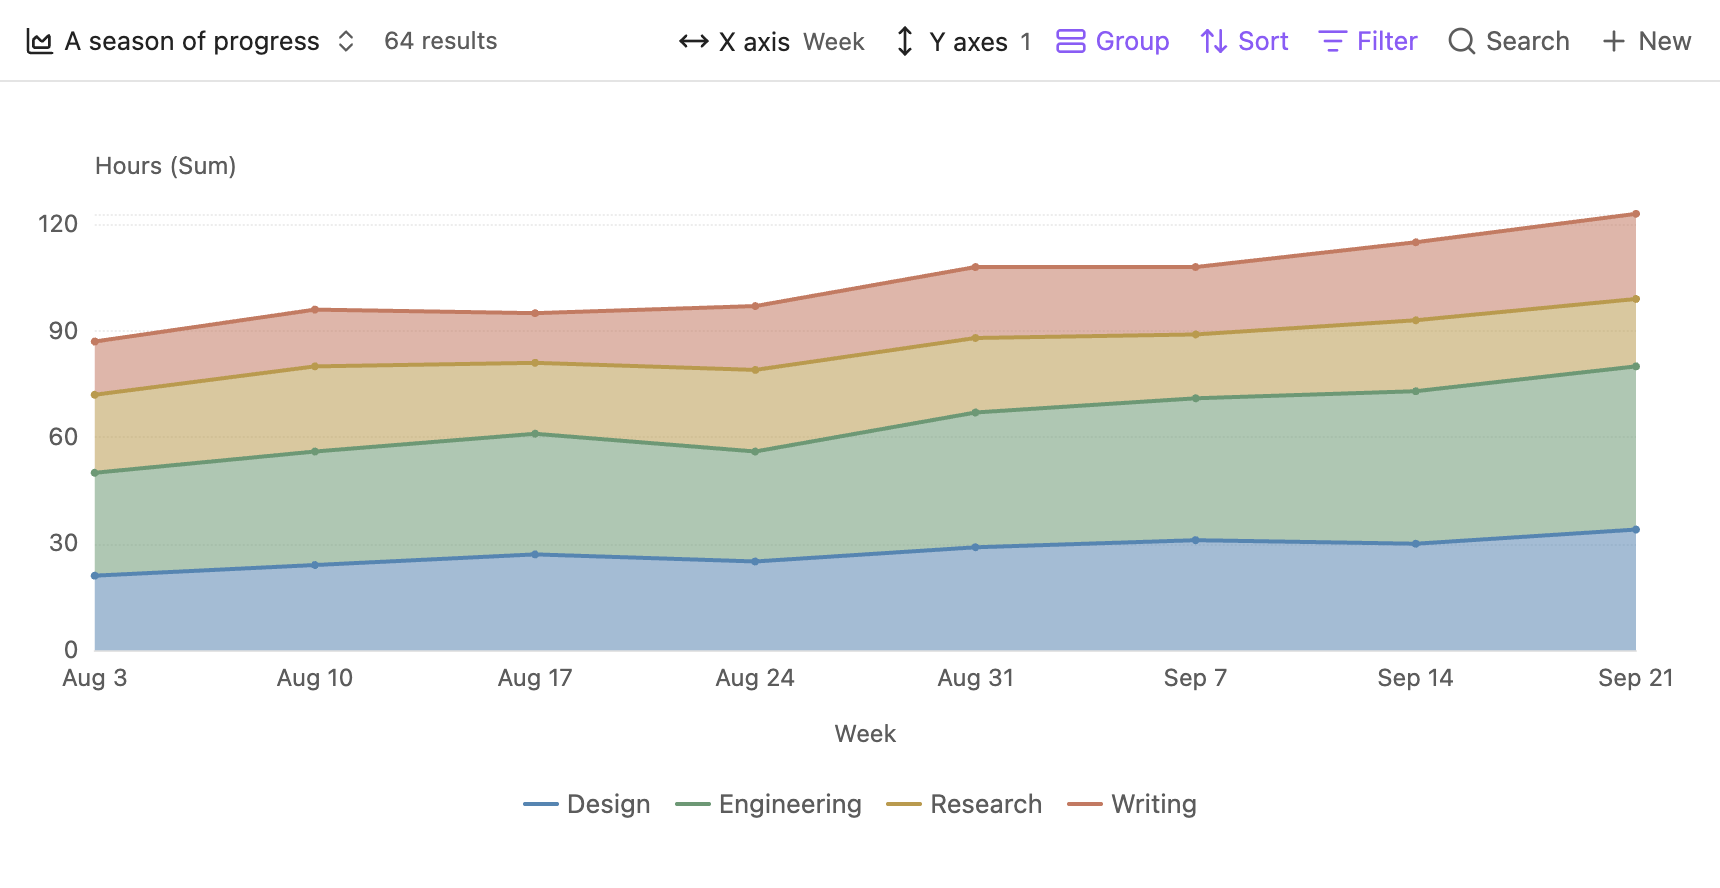
Workstream values stack into the total hours for each week.
Pie
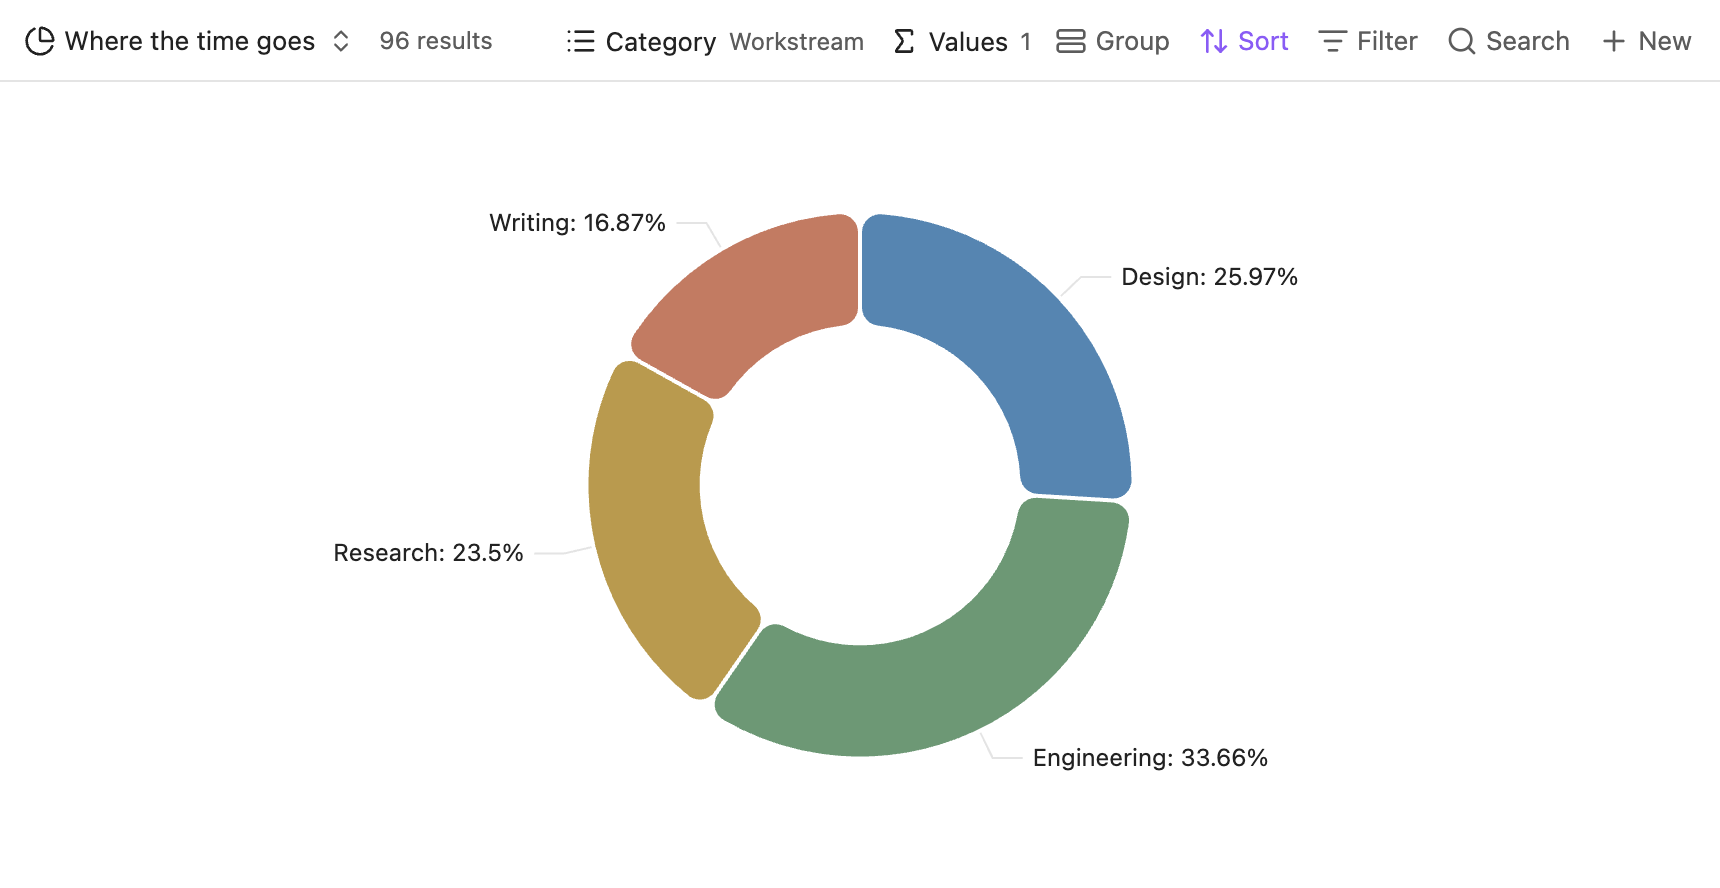
Percentage labels show each workstream’s share of the total hours.
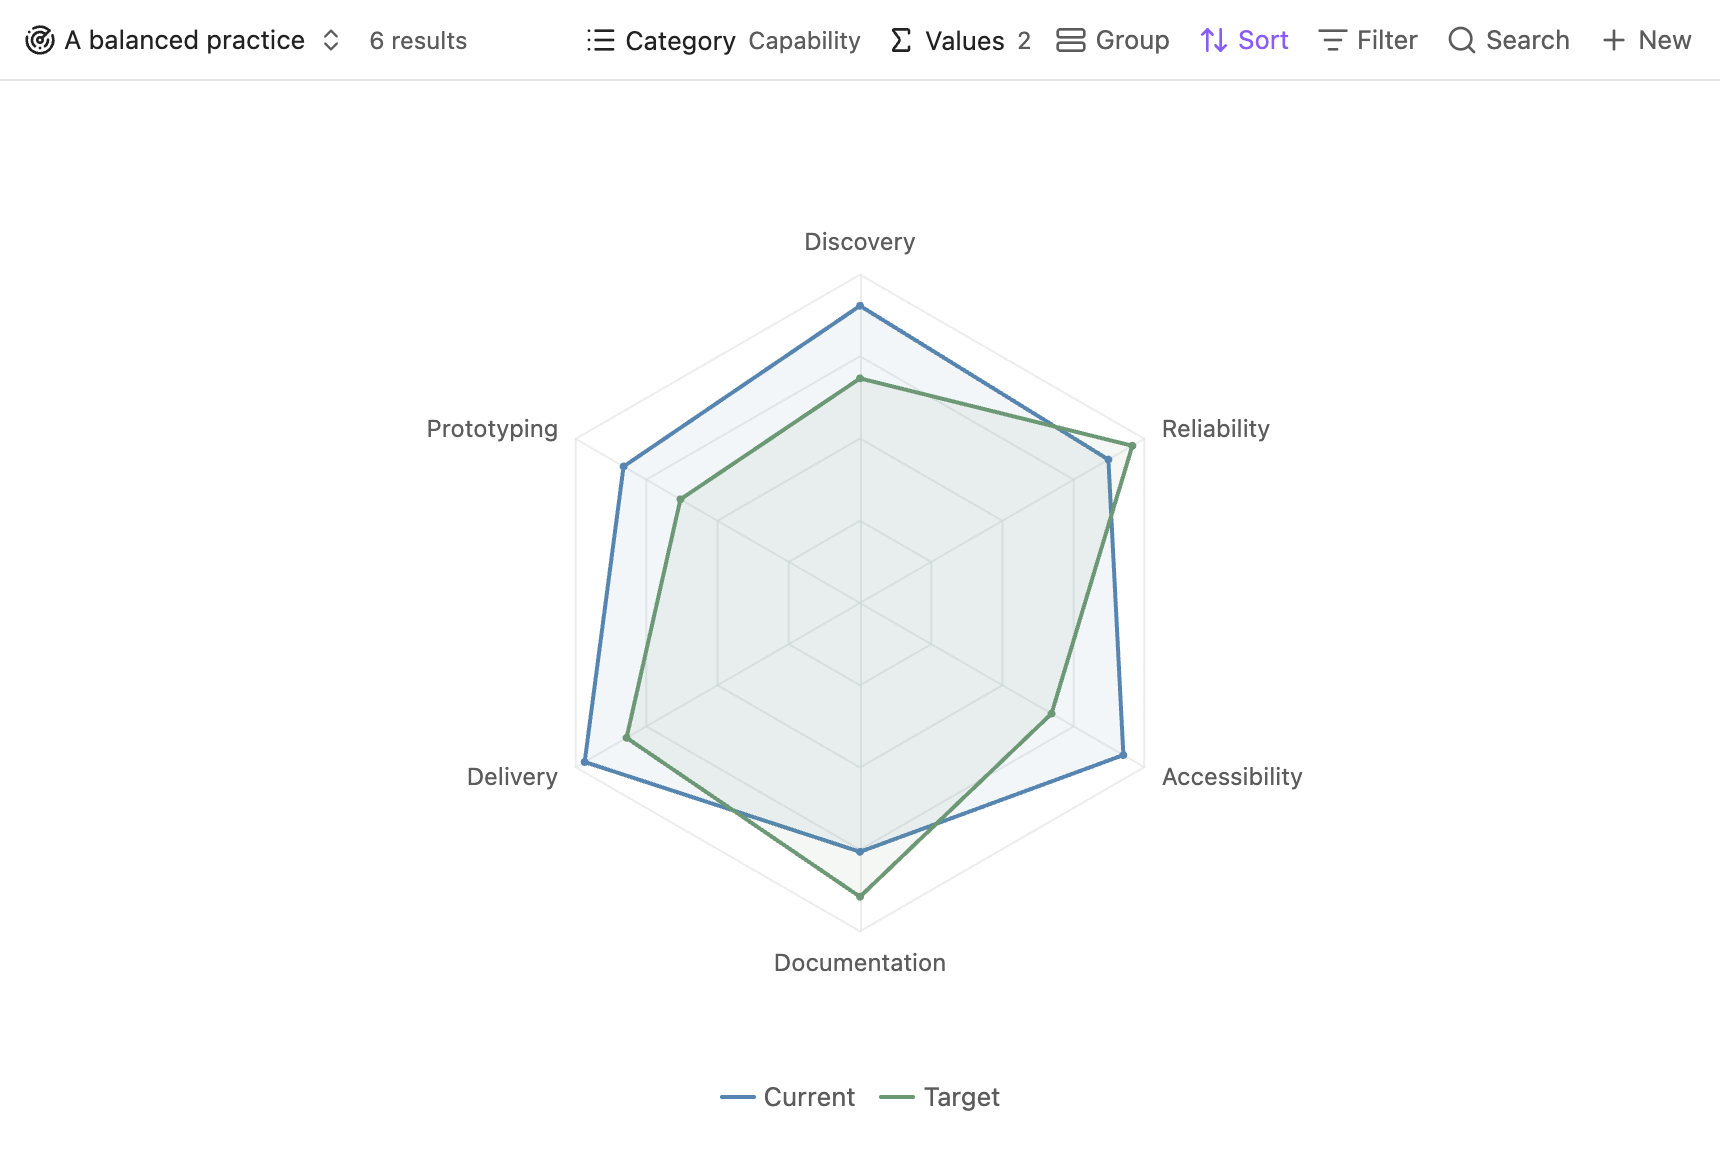
Radar
Current and target values share six capability axes in one chart.
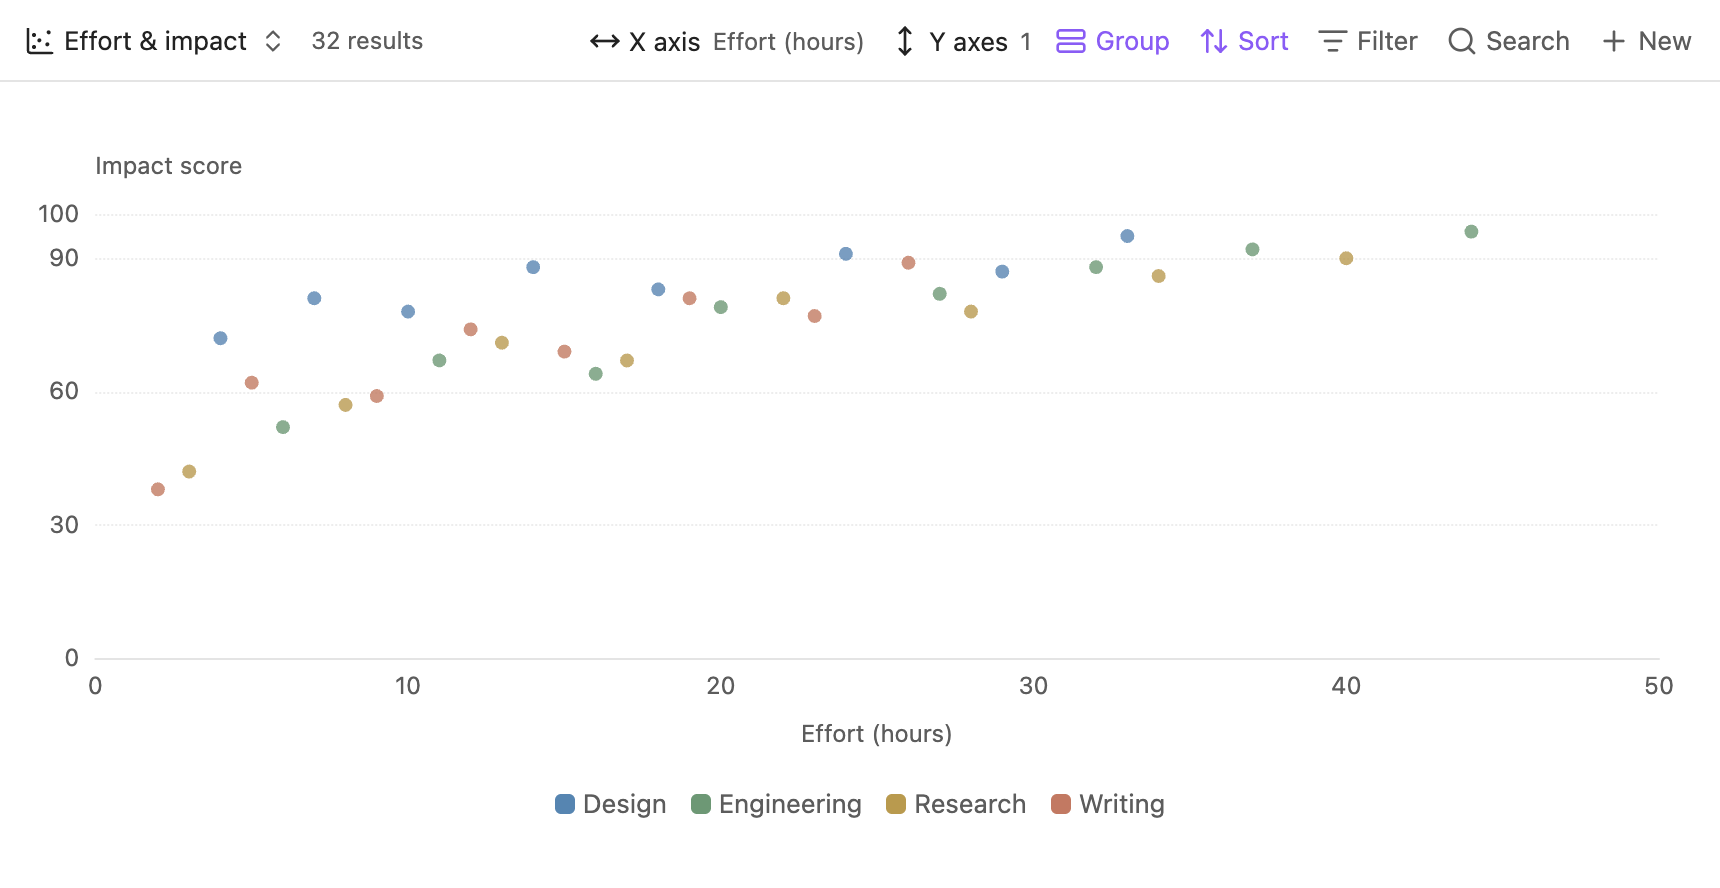
Scatter
Each point represents one of 32 initiatives. Color identifies its workstream.
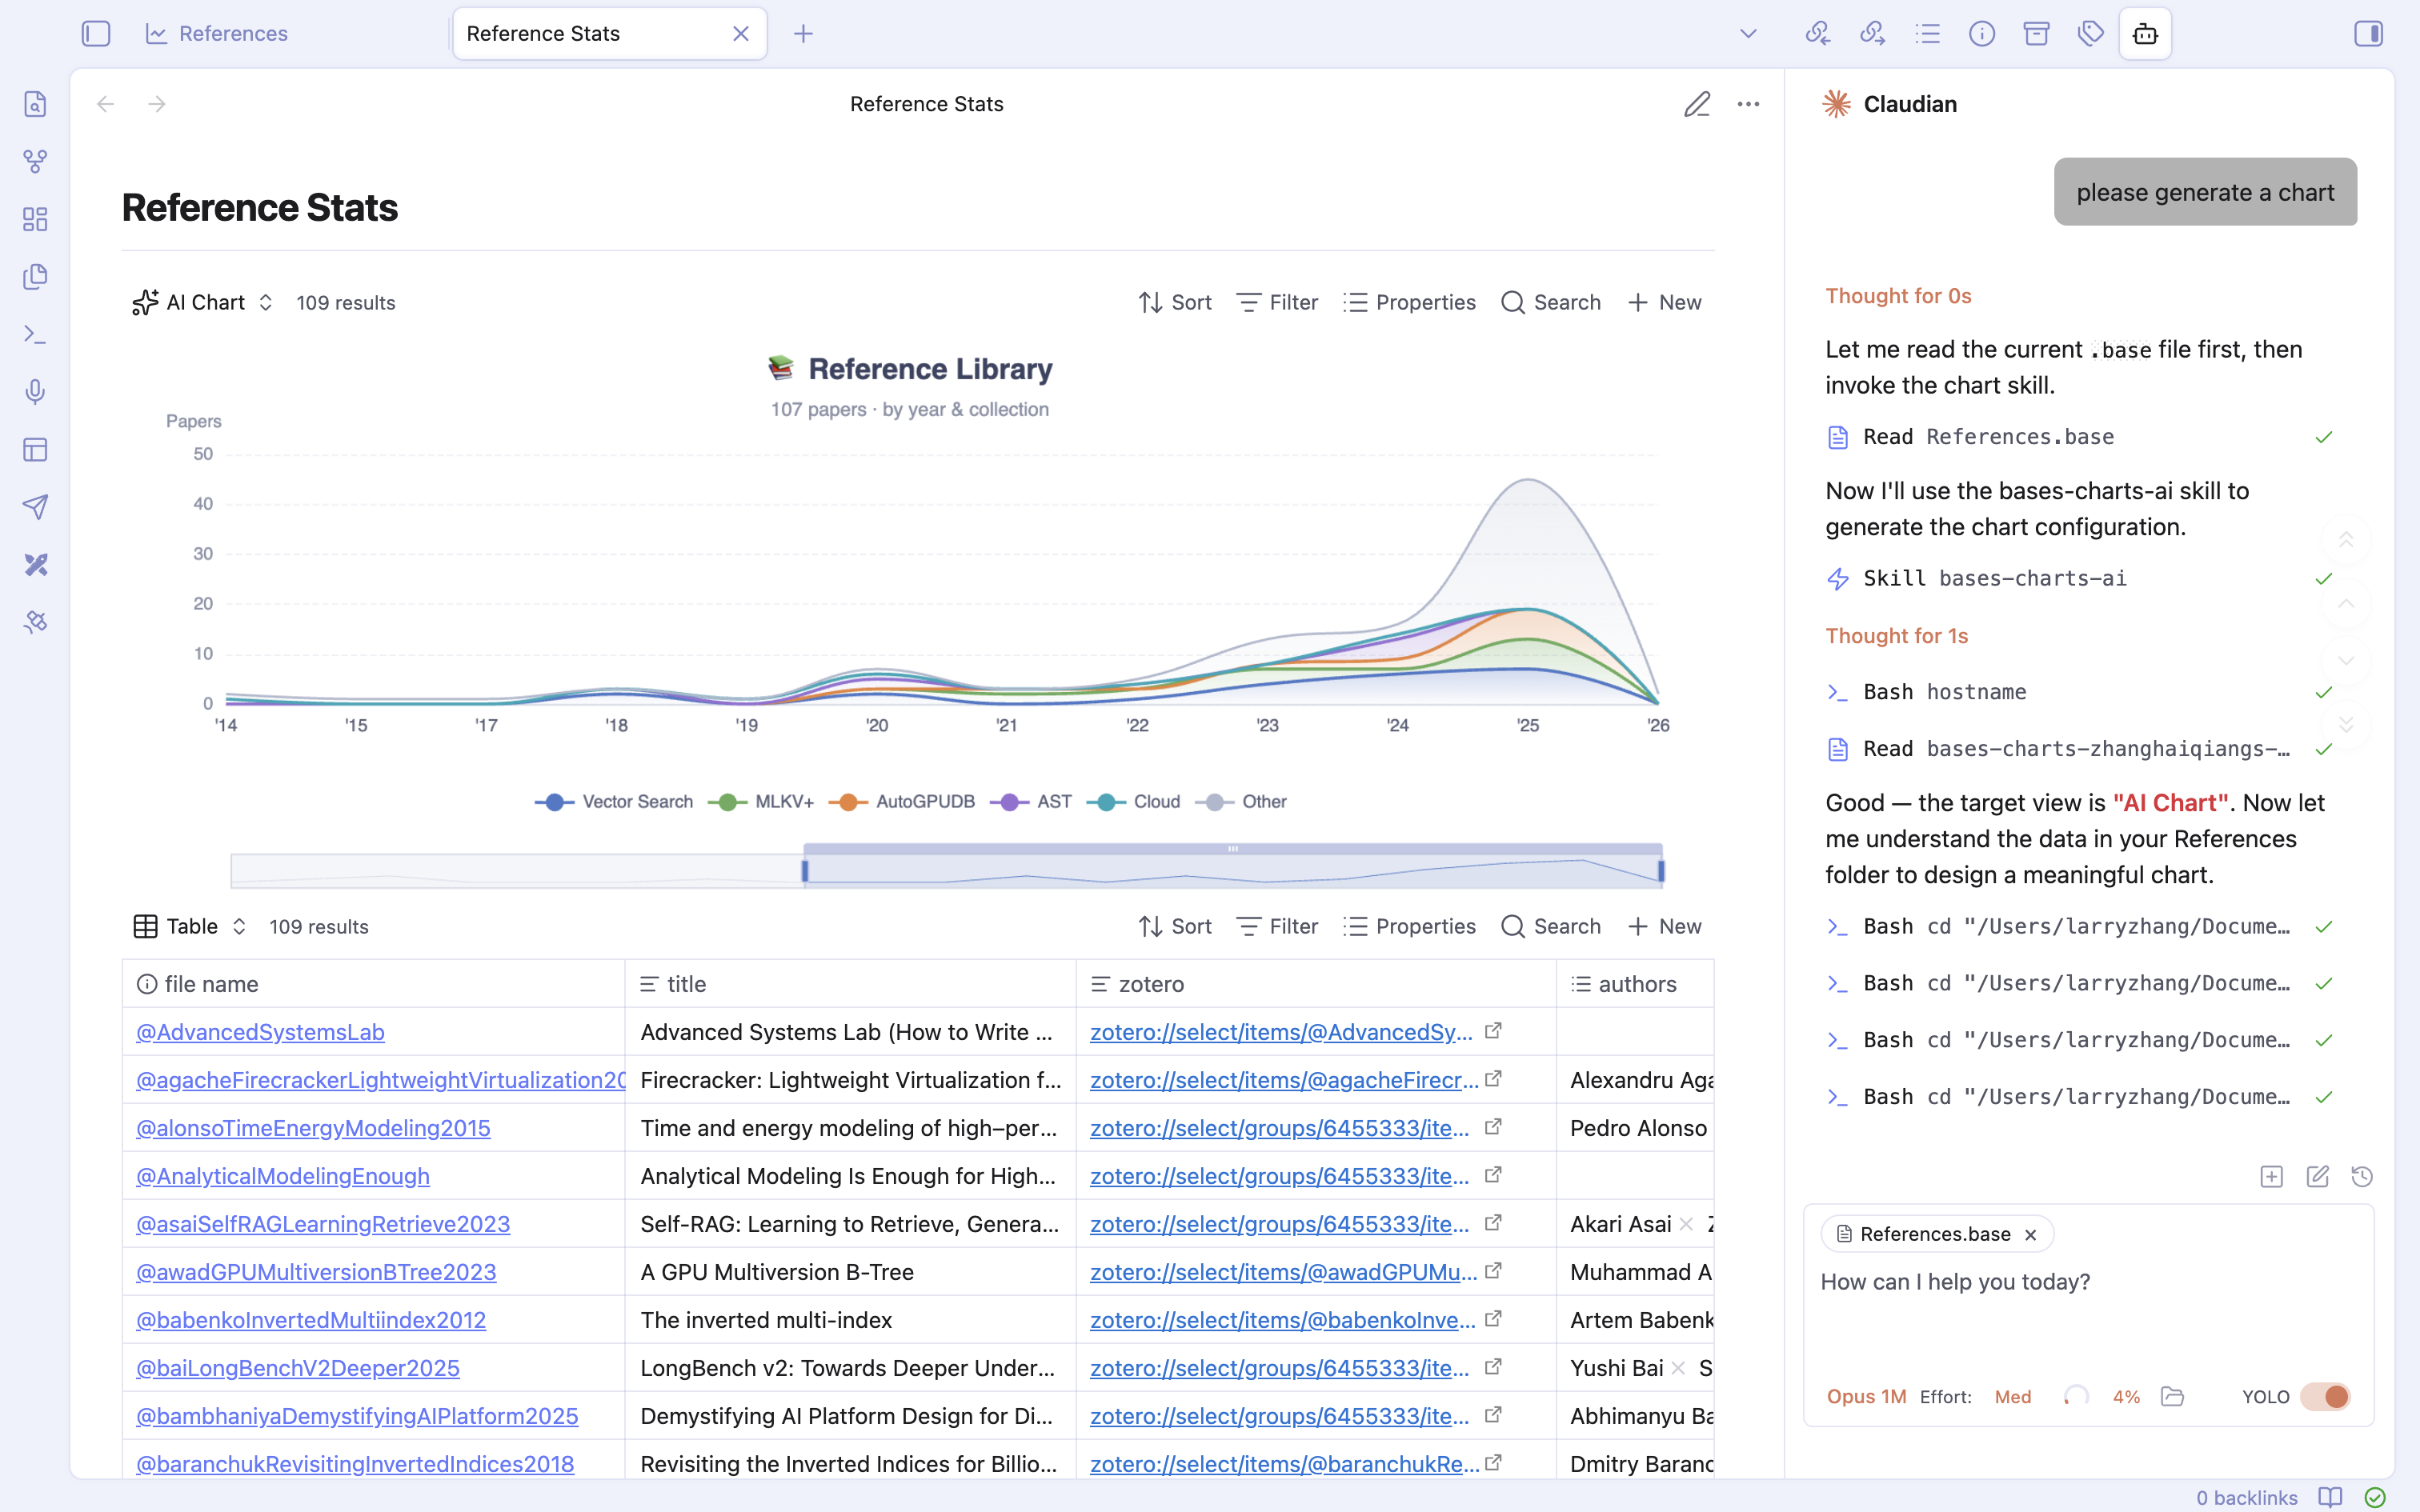
AI Chart
The Reference Library chart is shown alongside its source table and the Claudian conversation.
Dark theme
The chart palette and interface use Obsidian’s dark theme.