
AI Chart
AI Chart renders a saved Apache ECharts configuration. Use it for visualizations beyond the built-in Data Charts, such as a heatmap, Sankey diagram, treemap, graph, or gauge.
Claudian can read your data and write the configuration into the selected view in your .base file.
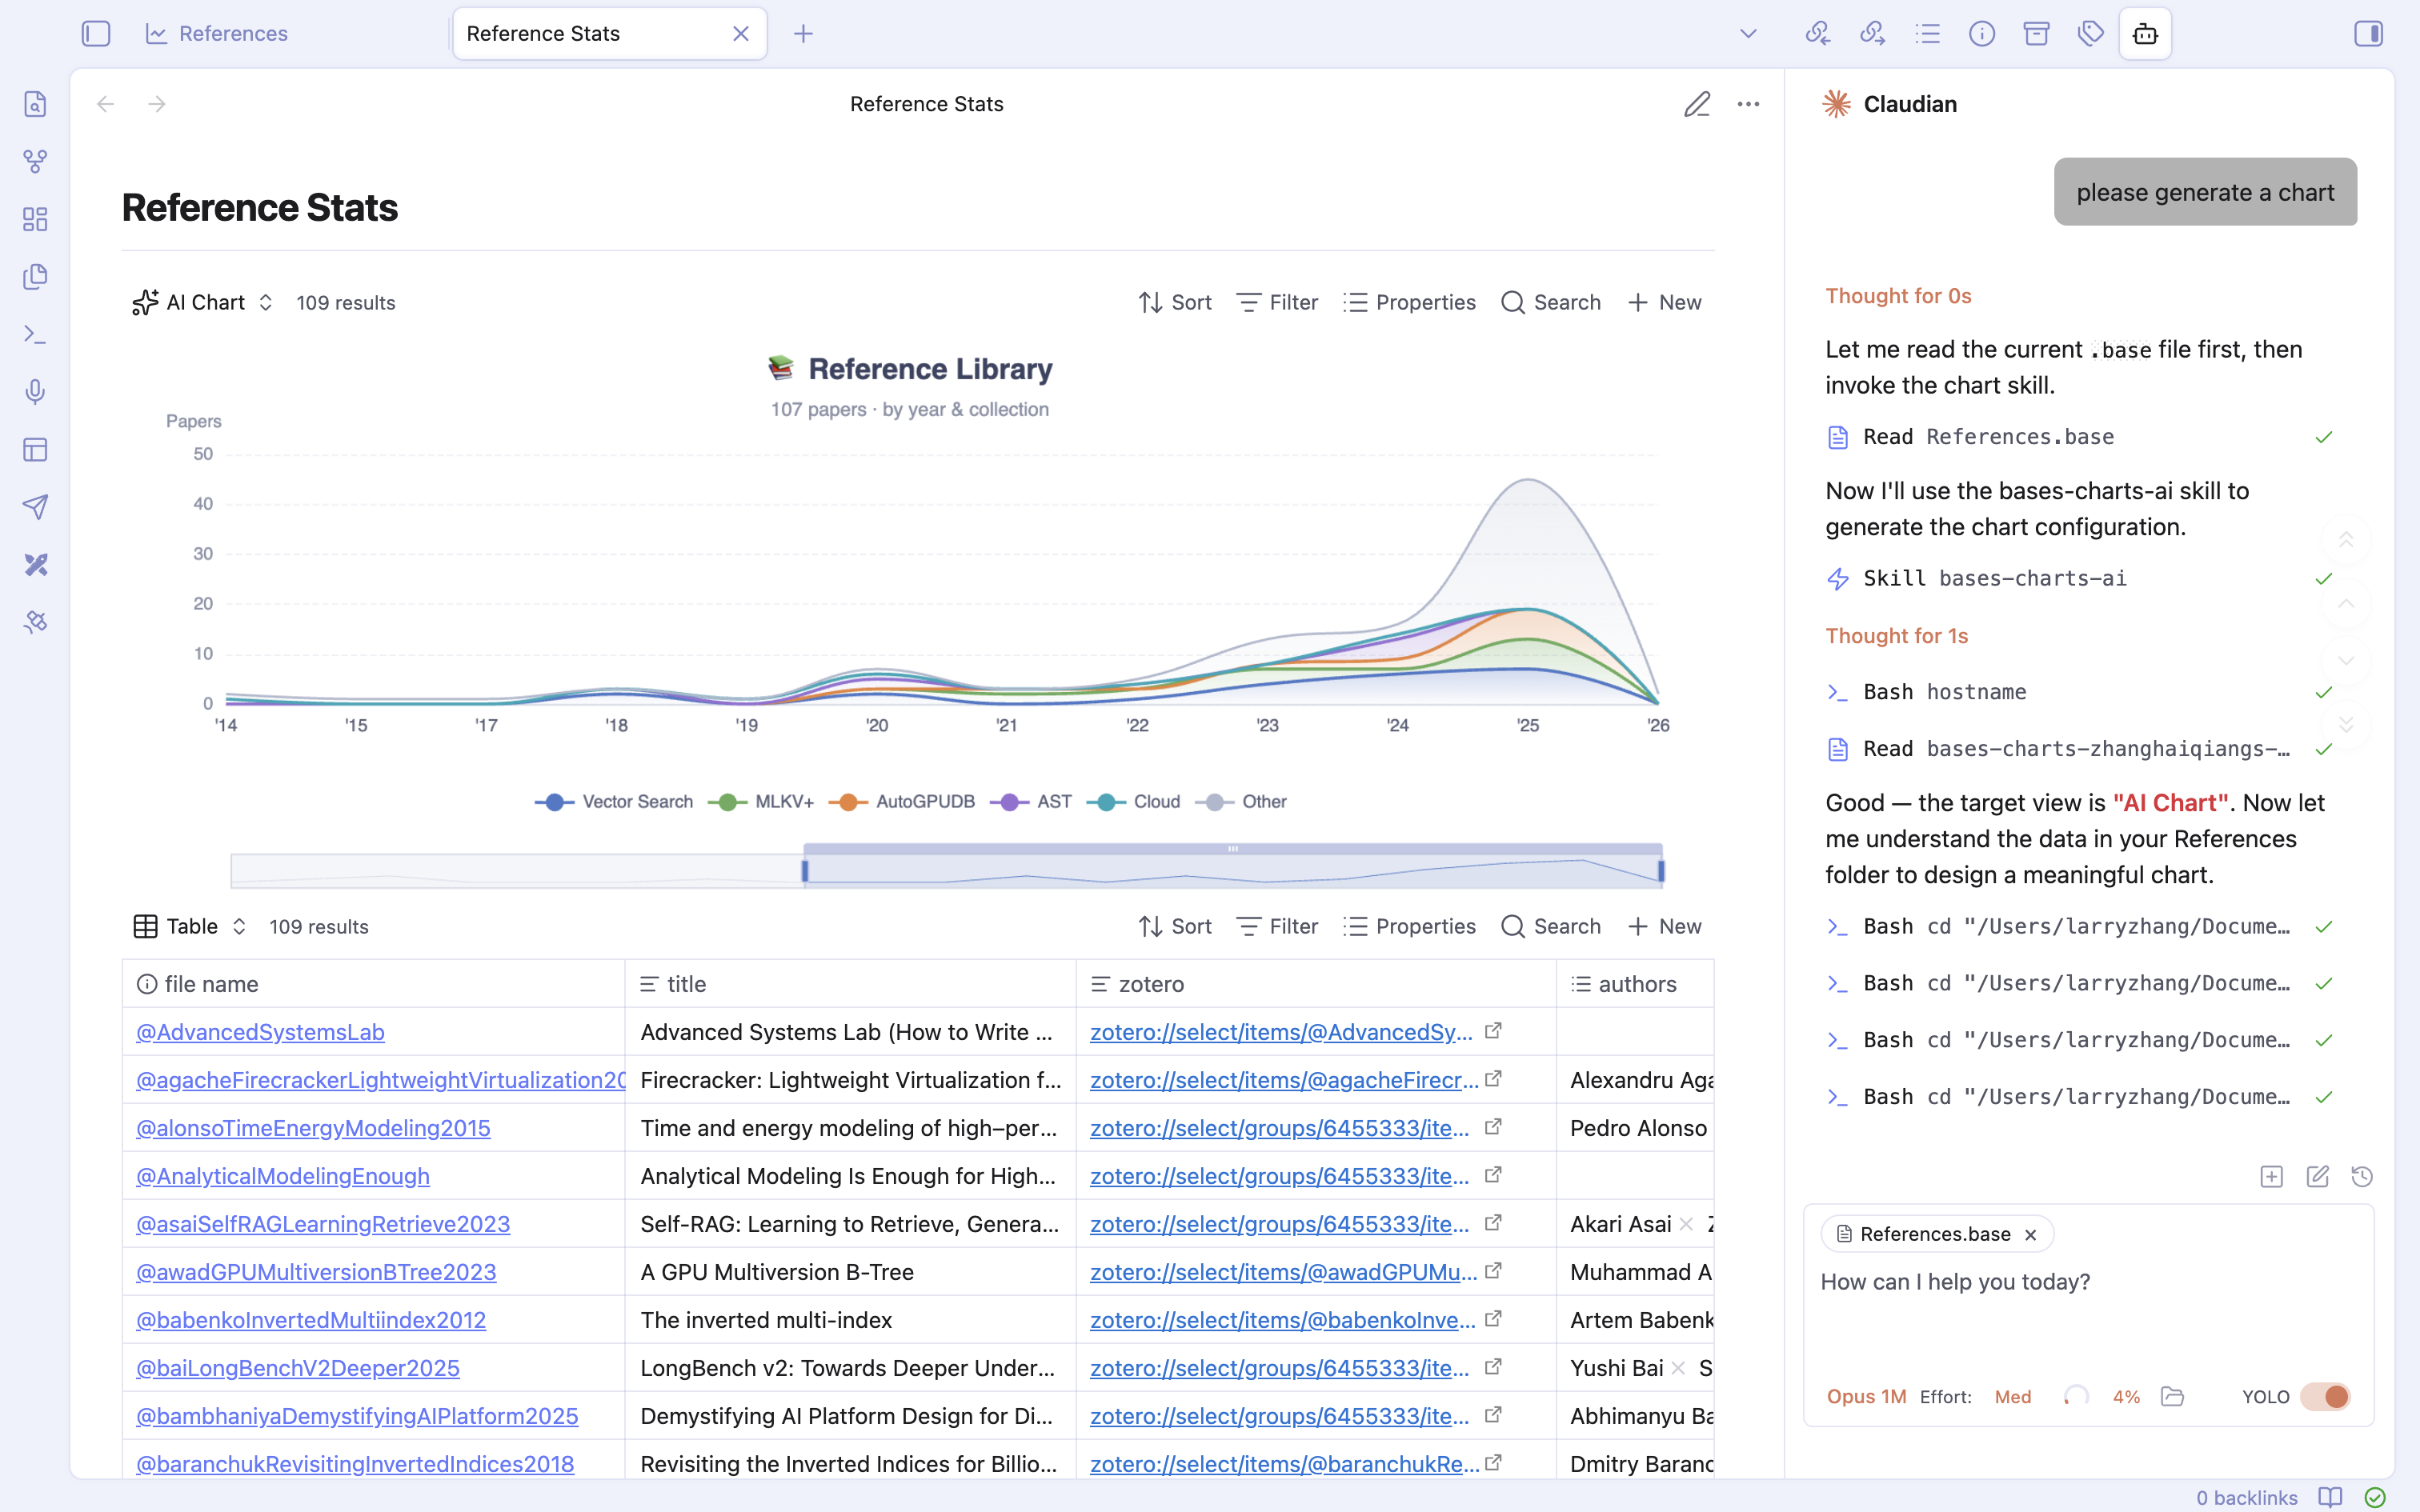
The example shows a Reference Library chart alongside the source table and Claudian conversation.
Set up
- Install Claudian and complete its setup.
- Add an AI Chart view to your Base.
- Choose Set up AI Chart.
- Ask Claudian to create the visualization for that Base and view.
Setup installs the plugin's bases-charts-ai skill and configures the associated Claudian system prompt. The skill describes the saved ECharts option format and how to find the active AI Chart view.
Example prompt
Specify the source data, chart type, and labels:
In this Base, create a heatmap of focus hours by weekday and time block. Use the session notes as the source, label the axes in English, and include a color scale.
Ask Claudian to update the option when you change the date range, labels, palette, or chart type.
How it differs from Data Charts
An AI Chart displays the data stored in its echarts-option configuration. It does not automatically convert the live Base result set into chart series.
When source notes change, ask Claudian to update the saved option if the visualization needs new data. The generated option defines labels, colors, tooltips, and layout. Built-in X/Y/Group controls and the source-file dialog belong to Data Charts, so they are not shown for AI Chart.
Configuration format
A minimal saved option looks like this:
ECharts options are stored as YAML data. JavaScript functions, such as function-valued formatters, cannot be represented in this saved format.
ECharts version
AI Chart uses Apache ECharts 6.1. When adapting older options, use axis.min to set an explicit axis minimum. In ECharts 6.1, axis.startValue does not implicitly set that minimum.
For a chart that updates directly with Bases properties and includes source-file inspection, choose a Data Chart.